S&P 500 Earnings Revisions Breadth
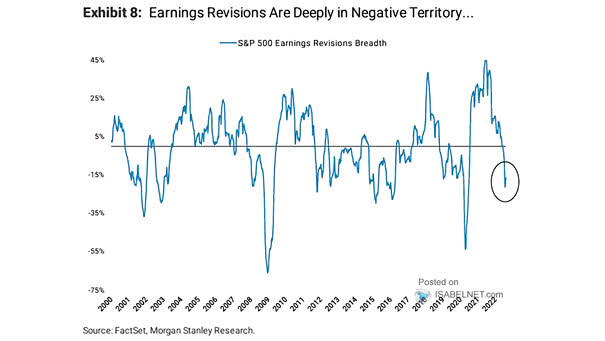
S&P 500 Earnings Revisions Breadth Should U.S. equity investors expect further downward earnings revisions? Image: Morgan Stanley Research
S&P 500 Earnings Revisions Breadth Should U.S. equity investors expect further downward earnings revisions? Image: Morgan Stanley Research
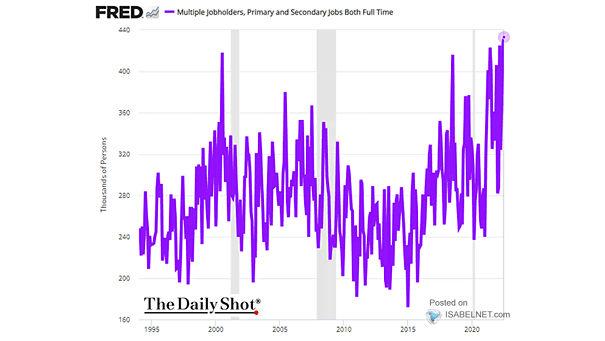
U.S. Labor Market – Multiple Jobholders, Primary and Secondary Jobs Full Time More Americans are taking on second jobs as the cost of living increases. Image: The Daily Shot
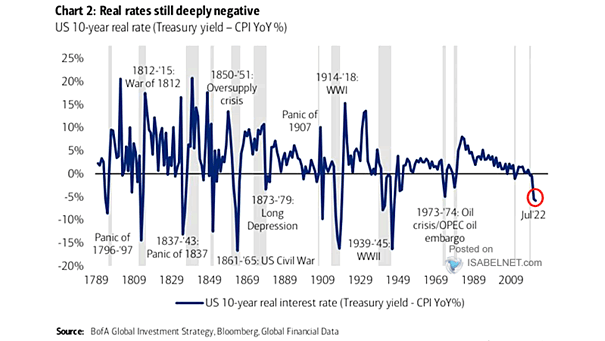
Rates – U.S. 10-Year Real Interest Rate How long will real U.S. 10-year interest rates remain negative? Image: BofA Global Investment Strategy
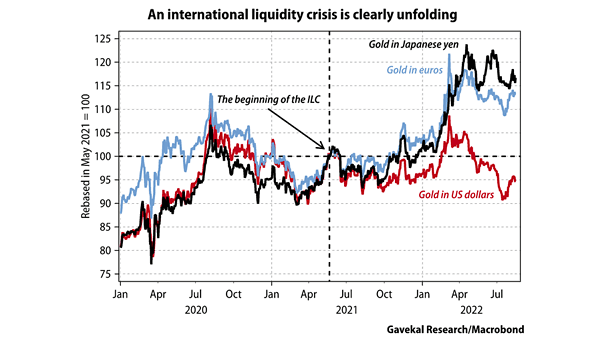
Gold in U.S. Dollar vs. Gold in Japanese Yen vs. Gold in Euros Should markets be worried about an international liquidity crisis? Image: Gavekal, Macrobond
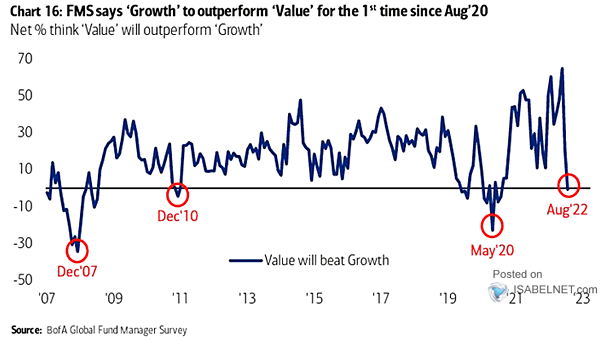
FMS Investors – Net % Say Value Will Beat Growth Will growth stocks outperform value stocks? Image: BofA Global Fund Manager Survey
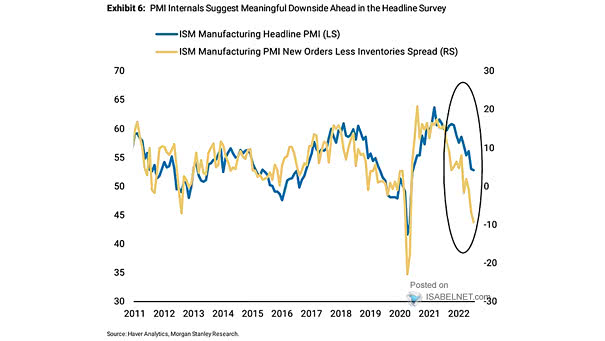
ISM Manufacturing PMI Headline vs. ISM Manufacturing New Orders – Inventories The ISM New Orders less Inventories suggests a lower ISM Manufacturing PMI. Image: Morgan Stanley Research
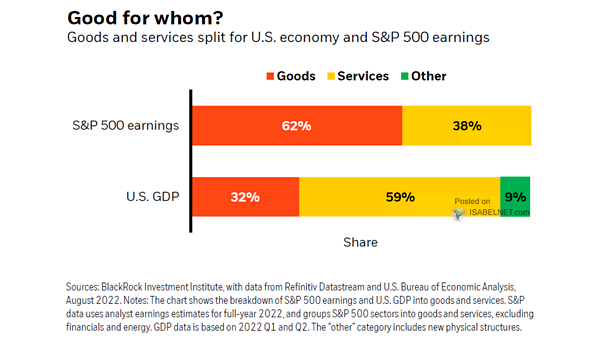
Goods and Services Split for U.S. Economy and S&P 500 Earnings Cooling demand for goods could hit U.S. stocks. Image: BlackRock Investment Institute
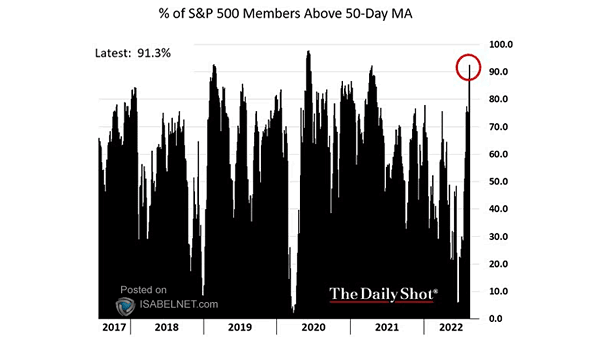
% of S&P 500 Members Trading Above 50-Day Moving Average Short-term overbought, but more than 90% of stocks above the 50-day moving average is historically bullish. Image: The Daily Shot
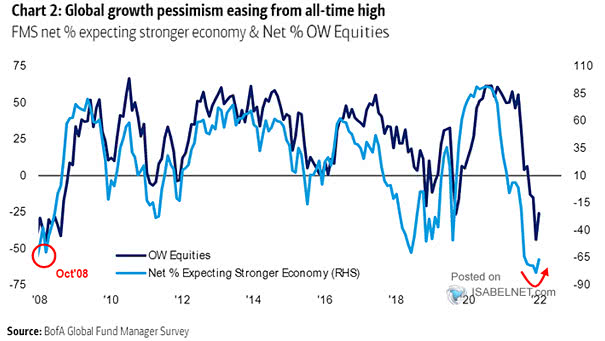
Net % OW Equities vs. Net % Expecting Stronger Economy Pessimism about global growth is easing, suggesting a higher net equity allocation. Image: BofA Global Fund Manager Survey
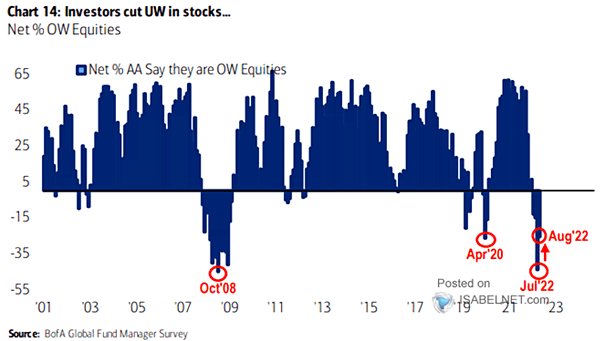
Net % OW Equities FMS investors cut their net underweight in stocks to -26% from -44%. Image: BofA Global Fund Manager Survey
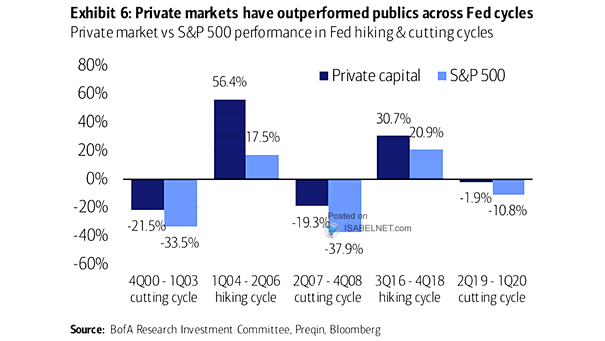
Private Market vs. S&P 500 Performance in Fed Hiking and Cutting Cycles Will private markets continue to outperform public markets? Image: BofA Research Investment Committee