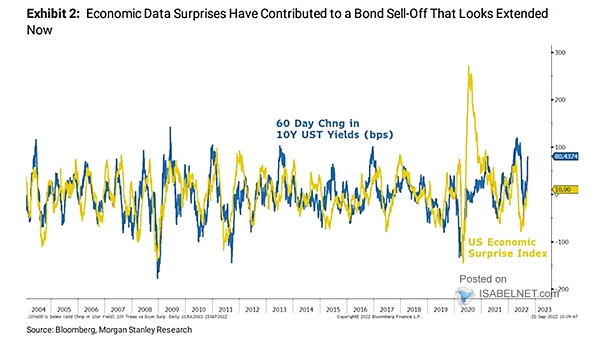
U.S. Economic Surprise Index vs. 60 Day Change in 10-Year U.S. Treasury Yields
U.S. Economic Surprise Index vs. 60 Day Change in 10-Year U.S. Treasury Yields Is the worst of the bond sell-off over? Image: Morgan Stanley Research
U.S. Economic Surprise Index vs. 60 Day Change in 10-Year U.S. Treasury Yields Is the worst of the bond sell-off over? Image: Morgan Stanley Research
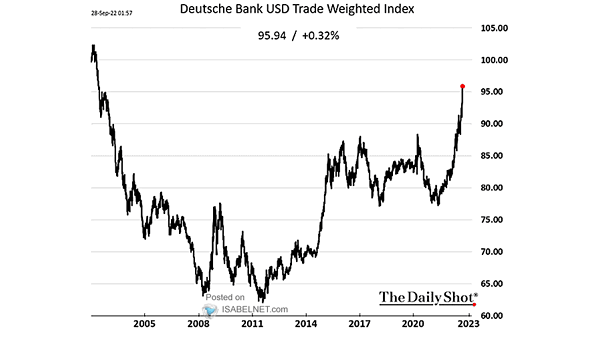
U.S. Dollar – Deutsche Bank USD Trade Weighted Index Is the U.S. dollar on the way to the moon? Image: The Daily Shot
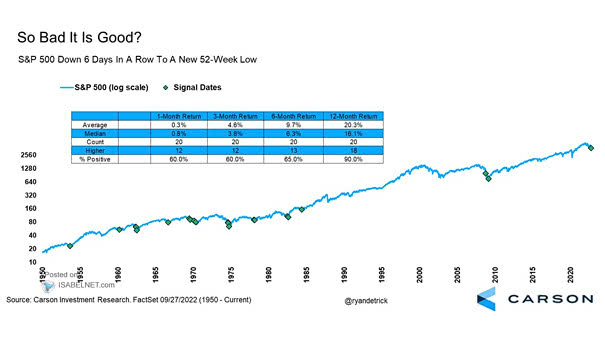
S&P 500 Down 6 Days in a Row to a New 52-Week Low When the S&P 500 is down 6 days in a row to a new 52-week low, it tends to be bullish over 12 months. Image: Carson Investment Research
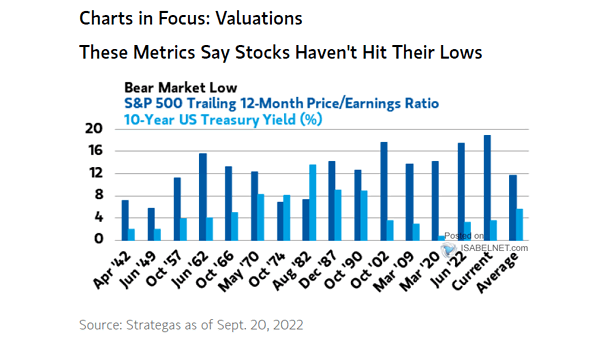
Bear Market Low – S&P 500 Trailing 12-Month P/E Ratio and 10-Year UST Yield Should U.S. equity investors expect the bear market to continue? Image: Morgan Stanley Wealth Management
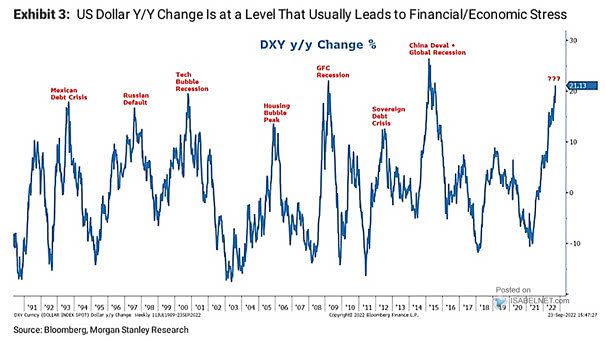
U.S. Dollar Index YoY Change (DXY) The soaring U.S. dollar is not good news for U.S. stocks. Image: Morgan Stanley Research
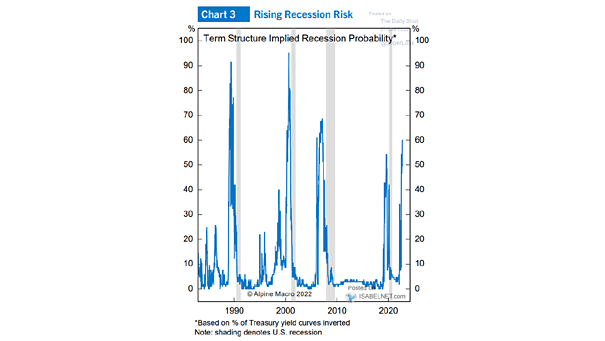
U.S. Recession Probability Indicator The odds of a recession in the United States are still rising. Image: Alpine Macro
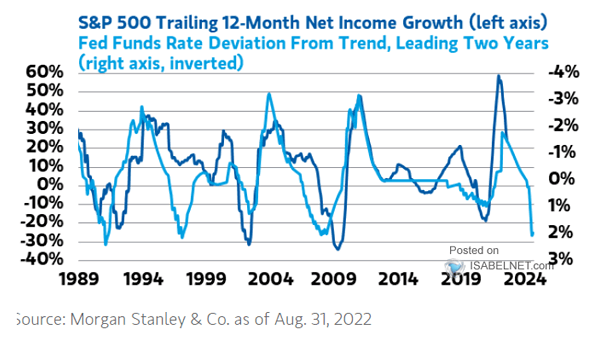
Earnings – S&P 500 Trailing 12-Month Net Income Growth vs. Fed Funds Rate Deviation from Trend (Leading Indicator) The change in fed funds rate suggests an earnings recession. Image: Morgan Stanley Wealth Management
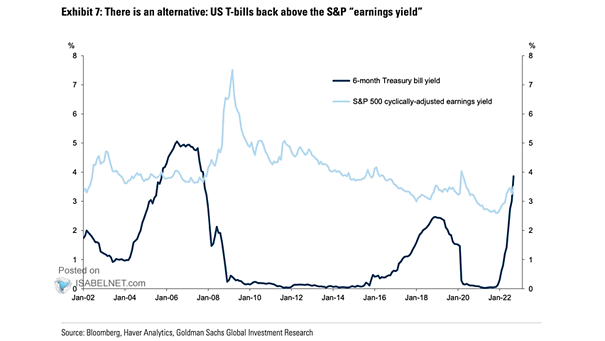
6-Month Treasury Bill Yield vs. S&P 500 Cyclically-Adjusted Earnings Yield Should investors favor U.S. T-bills over U.S. stocks? Image: Goldman Sachs Global Investment Research
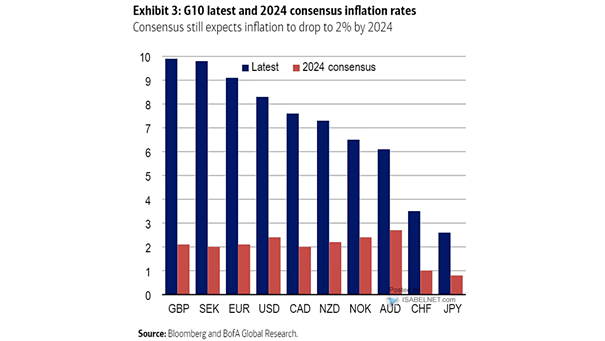
G10 Latest and Consensus Inflation Rates The inflation genie is out of the bottle, but consensus still expects inflation to drop to 2% by 2024. Image: BofA Global Research
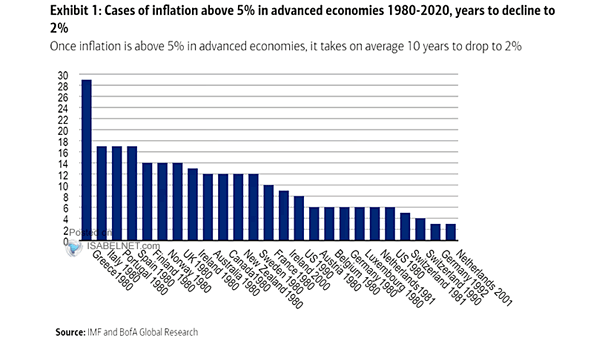
Cases of Inflation Above 5% in Advanced Economies and Years to Decline to 2% Will it take years to bring inflation down to 2%? Image: BofA Global Research
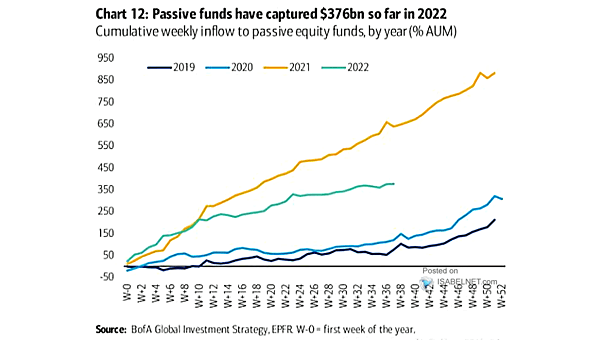
Flows – Cumulative Weekly Inflow to Passive Equity Funds Will flows into passive equity funds continue to rise? Image: BofA Global Investment Strategy