Volatility – S&P 500 Spot Price and VIX Index
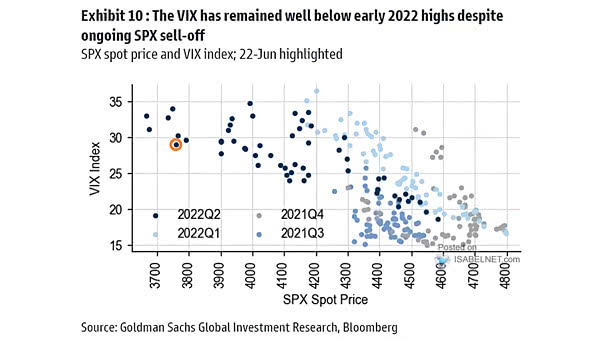
Volatility – S&P 500 Spot Price and VIX Index The VIX remains below early 2022 peaks, despite the sell-off. Image: Goldman Sachs Global Investment Research
Volatility – S&P 500 Spot Price and VIX Index The VIX remains below early 2022 peaks, despite the sell-off. Image: Goldman Sachs Global Investment Research
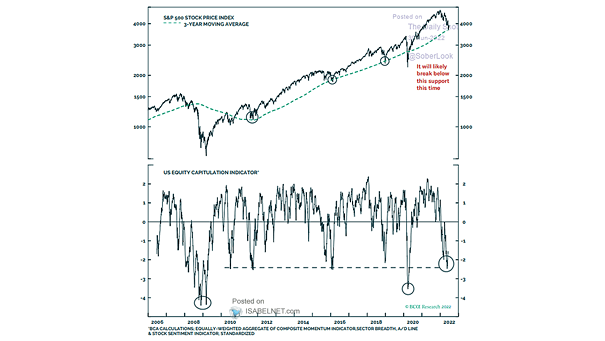
S&P 500 Index and 3-Year Moving Average The S&P 500 will likely break below its 3-year moving average, as recession fears mount. Image: BCA Research
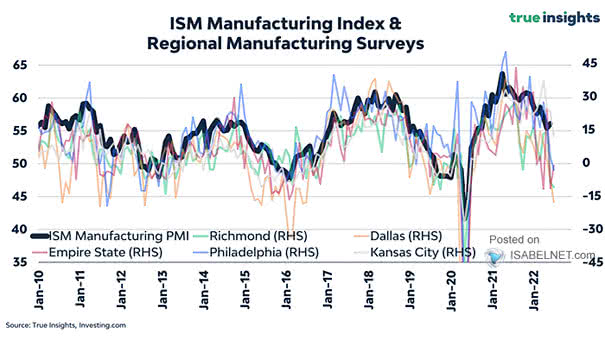
ISM Manufacturing Index and Regional Manufacturing Surveys Regional manufacturing surveys do not bode well for the ISM Manufacturing Index. Image: True Insights
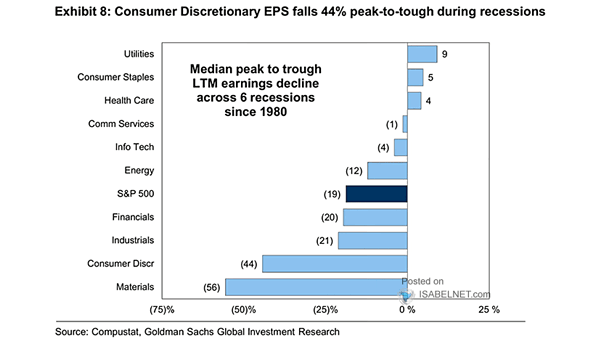
Median Peak to Trough LTM Earnings Decline Across 6 Recessions On average, S&P 500 earnings fall 19% peak-to-trough during recessions. Image: Goldman Sachs Global Investment Research
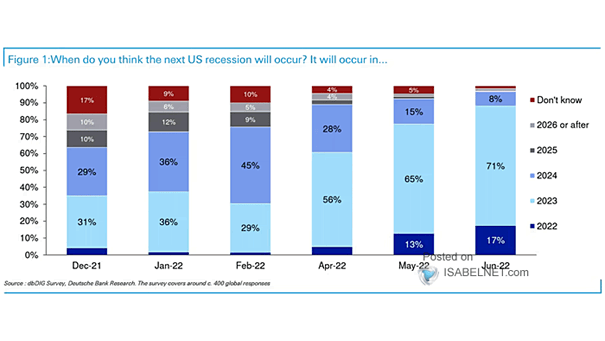
Survey – When Will the Next U.S. Recession Occur? Only 17% of respondents expect the next U.S. recession to occur this year. Image: Deutsche Bank Research
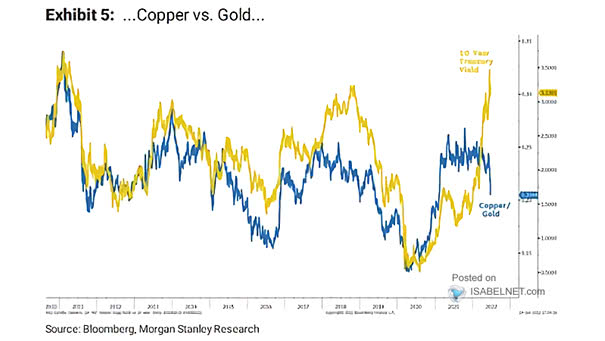
Copper to Gold Ratio and 10-Year U.S. Treasury Yield Does the copper to gold ratio suggest stagflation is around the corner? Image: Morgan Stanley Research
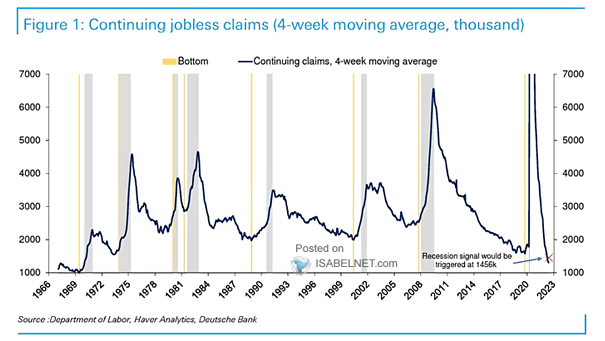
Continuing Jobless Claims and U.S. Recessions A jump in continuing jobless claims will signal an imminent U.S. recession. Image: Deutsche Bank
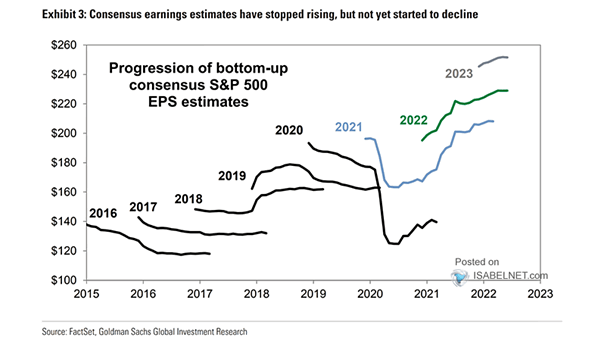
Progression of Bottom-Up Consensus S&P 500 EPS Estimates Consensus earnings estimates are likely too elevated. Image: Goldman Sachs Global Investment Research
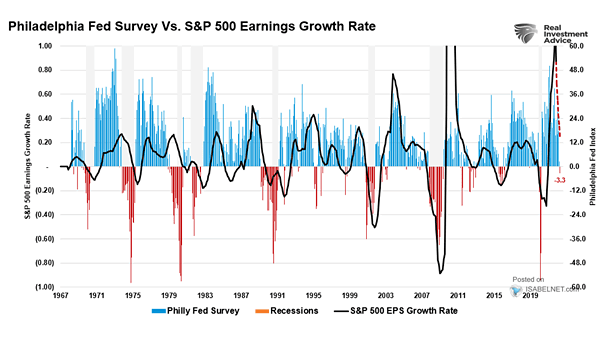
Philadelphia Fed Survey vs. S&P 500 Earnings Growth Rate The bear market bottom is probably not yet in as the Philly Fed survey suggests an earnings recession is highly likely. Image: Real Investment Advice
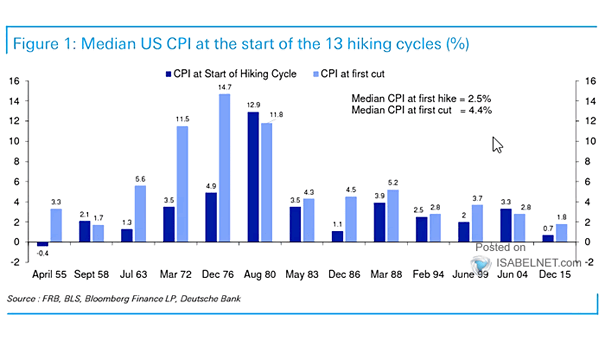
Fed – Median U.S. CPI at the Start of the 13 Hiking Cycles Could the Fed cut rates even if inflation remains elevated? Image: Deutsche Bank
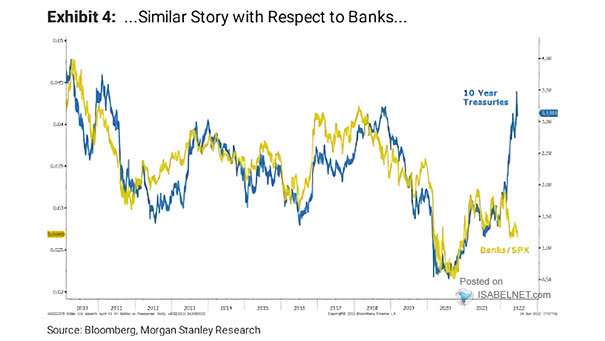
U.S 10-Year Treasury Yield and Banks/S&P 500 What will the U.S. 10-year Treasury yield be at the end of the year? Image: Morgan Stanley Research