S&P 500 Following Sentiment Extremes
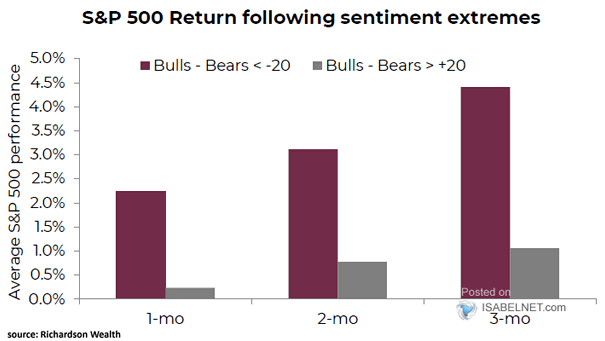
S&P 500 Following Sentiment Extremes The latest AAII U.S. investor sentiment bull – bear spread suggests promising S&P 500 returns over the next few months. Image: Richardson Wealth
S&P 500 Following Sentiment Extremes The latest AAII U.S. investor sentiment bull – bear spread suggests promising S&P 500 returns over the next few months. Image: Richardson Wealth
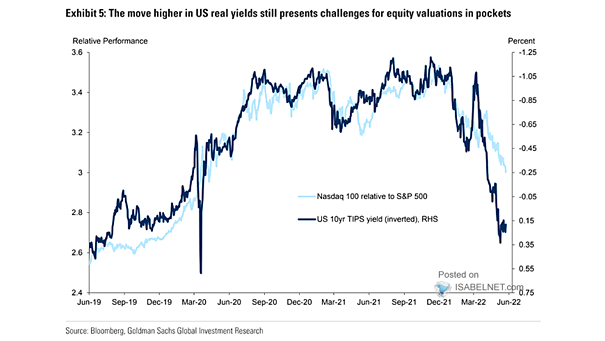
Valuation – Nasdaq 100 Relative to S&P 500 vs. U.S. 10-Year TIPS Yield Historically, it’s good for the U.S. stock market if U.S. real yields remain modestly positive. Image: Goldman Sachs Global Investment Research
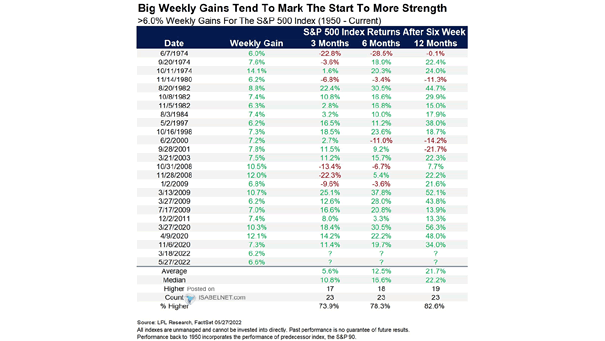
Returns – >6% Weekly Gains for the S&P 500 Index Historically, weekly gains of more than 6% tend to be bullish for U.S. stocks over 3, 6 and 12 months. Image: LPL Research
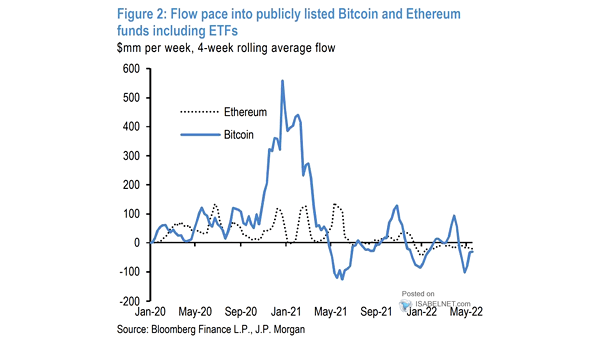
Flow Pace into Publicly Listed Bitcoin and Ethereum Funds Including ETFs Flows into Bitcoin and Ethereum funds remain negative. Image: J.P. Morgan
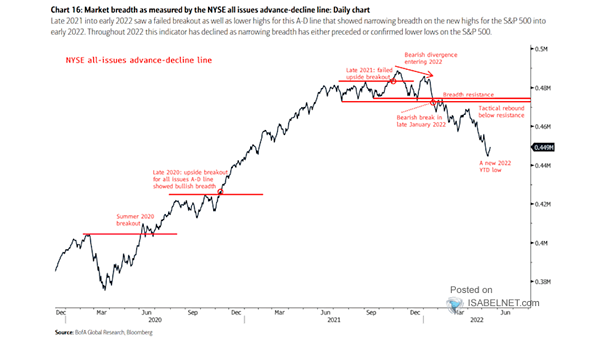
NYSE Stocks Advance-Decline Line Market breadth has declined sharply throughout 2022. Image: BofA Global Research
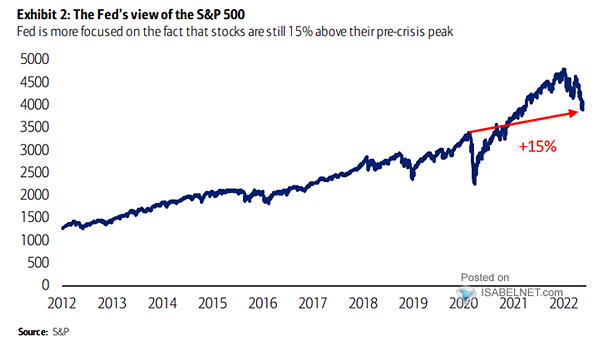
The Fed’s View of the S&P 500 Where is the Fed put? After the recent sell-off, the Fed and investors do not view the S&P 500 through the same lens. Image: BofA Global Research
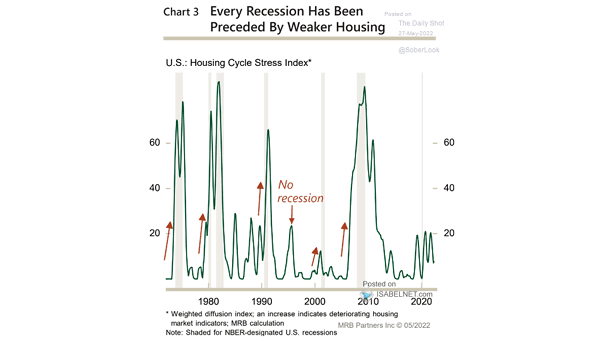
U.S. Recession – Housing Cycle Stress Index Should investors expect the possibility of a significant weakening in the housing sector this year? Image: MBR Partners
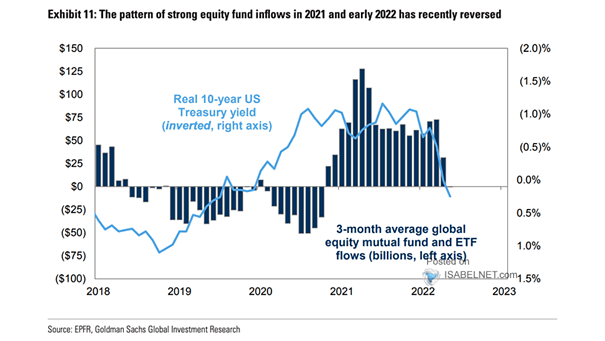
3-Month Average Mutual Fund and ETF Flows and Real 10-Year U.S. Treasury Yield Flows into mutual funds and ETFs have been very strong. Image: Goldman Sachs Global Investment Research
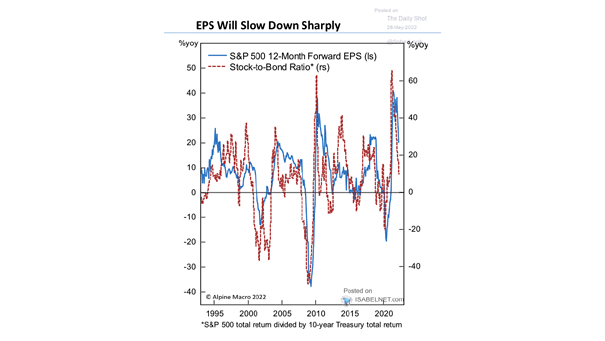
S&P 500 12-Month Forward EPS and Stock-to-Bond Ratio Will the S&P 500 continue to fall as earnings growth slows? Image: Alpine Macro
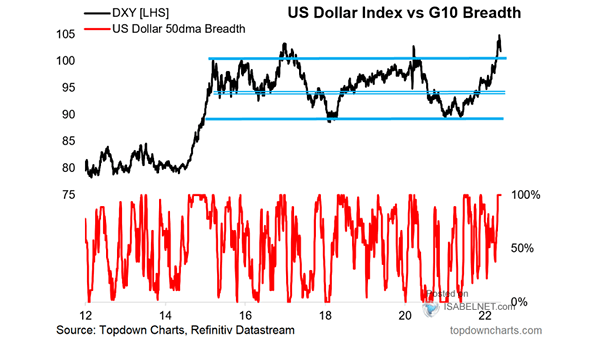
U.S. Dollar Index vs. G10 Breadth Will the U.S. dollar move lower after the recent spike? Image: Topdown Charts
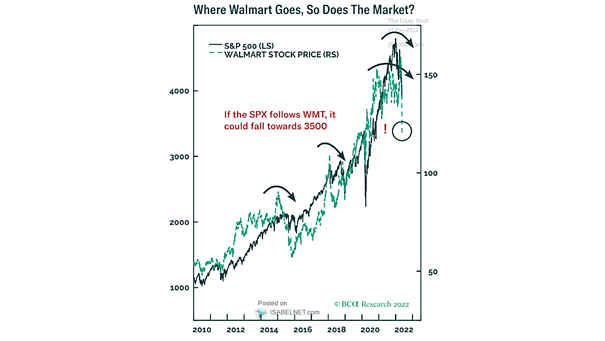
S&P 500 vs. Walmart Stock Price Will the S&P 500 follow Walmart’s stock price? Image: BCA Research