VIX and the S&P 500’s Distance from its 12-Month High
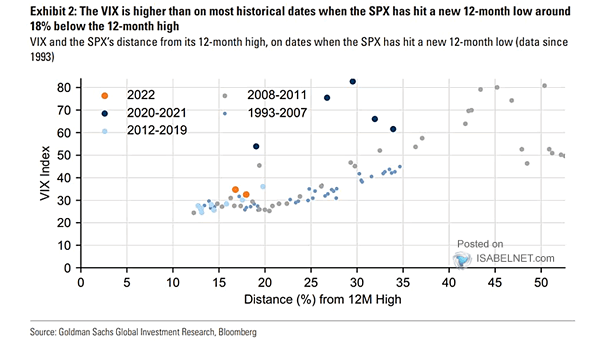
VIX and the S&P 500’s Distance from its 12-Month High Should investors expect a higher VIX regime going forward? Image: Goldman Sachs Global Investment Research
VIX and the S&P 500’s Distance from its 12-Month High Should investors expect a higher VIX regime going forward? Image: Goldman Sachs Global Investment Research
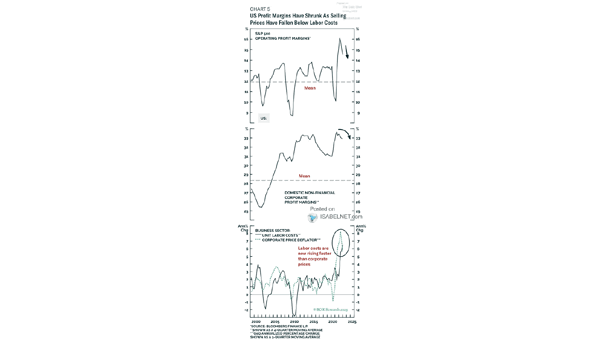
S&P 500 Operating Profit Margins U.S. profit margins have narrowed as corporate prices have become lower than labor costs. Image: BCA Research
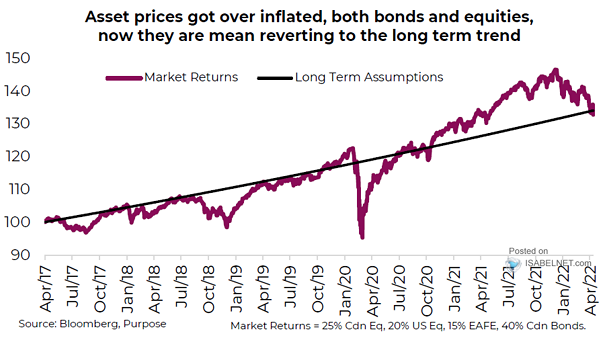
Market Returns and Long Term Assumptions Is the recent market’s sell-off a buying opportunity? Image: Richardson Wealth
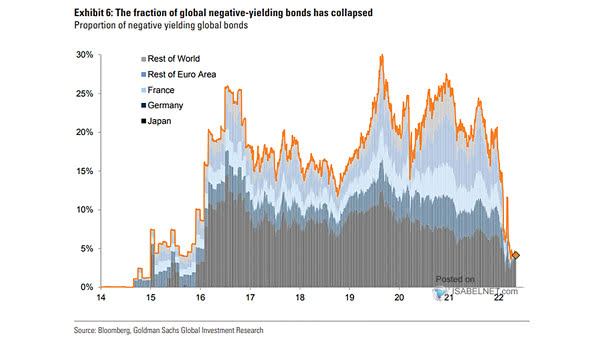
Proportion of Negative Yielding Global Bonds The proportion of global bonds with negative yields has fallen sharply. Image: Goldman Sachs Global Investment Research
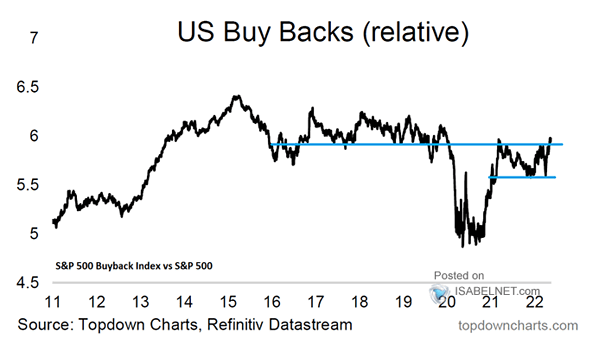
S&P 500 Buyback Index vs. S&P 500 Could buybacks support U.S. stocks in the near-term? Image: Topdown Charts
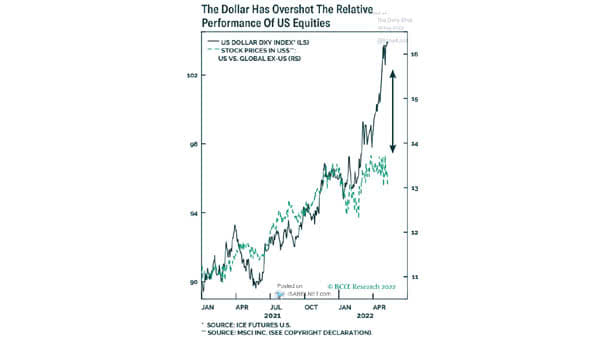
U.S. Dollar DXY Index vs. Stock Prices (U.S. vs. Global Ex-U.S.) How long will the strength of the U.S. dollar last? Image: BCA Research
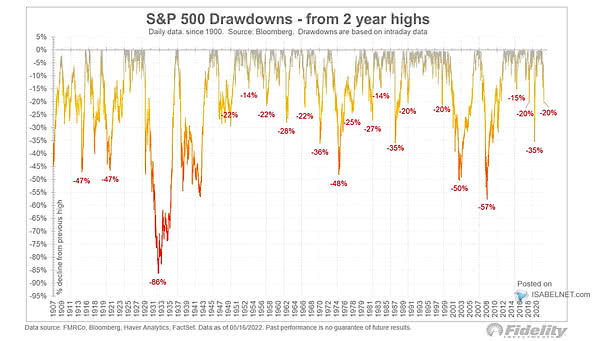
S&P 500 Drawdowns From 2 Year Highs Do investors have the courage to invest in U.S. stocks right now? Image: Fidelity Investments
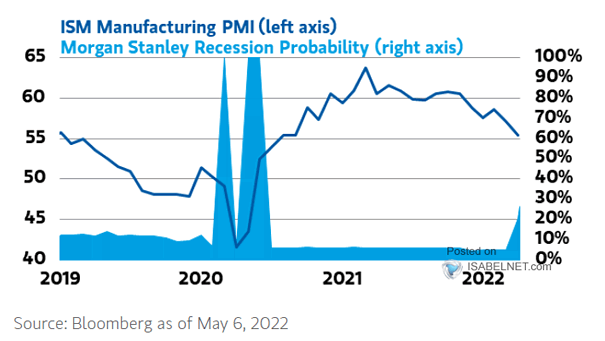
ISM Manufacturing PMI and Recession Probability Morgan Stanley’s recession indicator signals a 27% probability of a downturn in the next 12 months. Image: Morgan Stanley Wealth Management

Commodities Breadth Tapering After a historic two years, should investors be bearish on commodities right now? Image: Topdown Charts
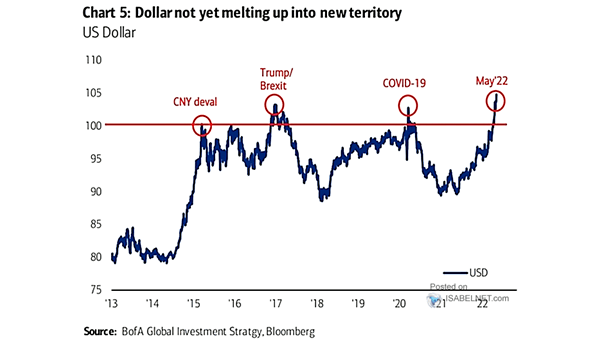
U.S. Dollar May the U.S. dollar be reaching a peak? Image: BofA Global Investment Strategy
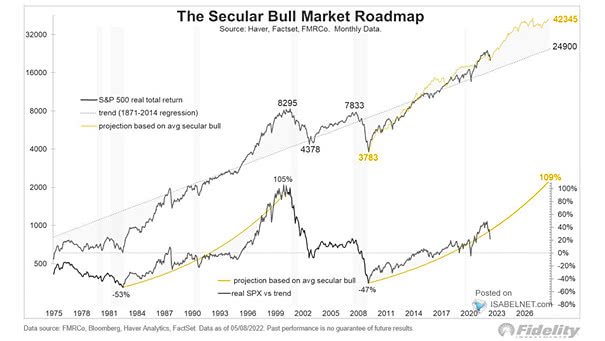
S&P 500 – The Secular Bull Market Roadmap So far, U.S. stocks continue to behave like a secular bull market. Image: Fidelity Investments