Average S&P 500 6-Month Return
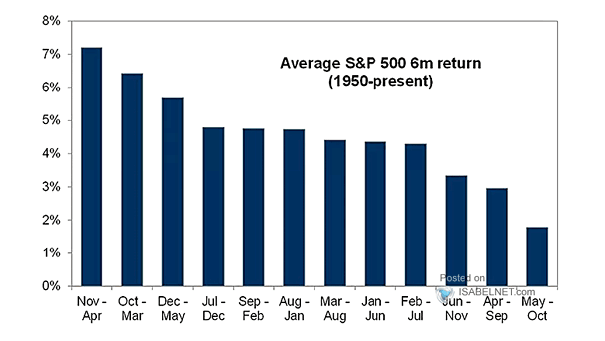
Average S&P 500 6-Month Return Should investors ignore the old adage “sell in May and go away?” Image: Goldman Sachs Global Investment Research
Average S&P 500 6-Month Return Should investors ignore the old adage “sell in May and go away?” Image: Goldman Sachs Global Investment Research
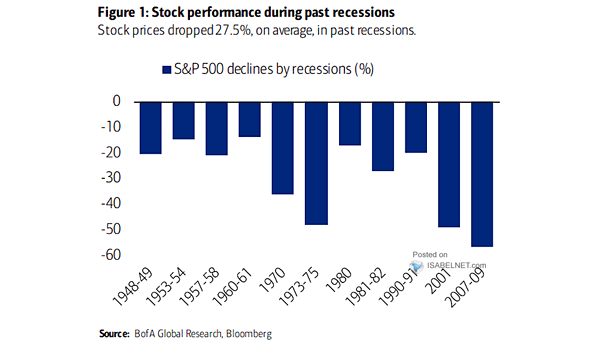
Performance – S&P 500 Declines by Recessions The S&P 500 declined an average of 27.5% over the past 11 recessions. Image: BofA Global Research
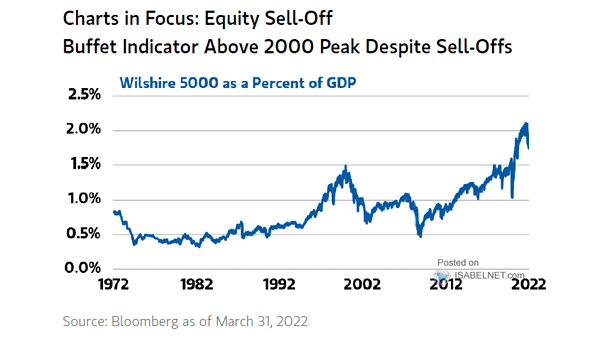
Valuation – Wilshire 5000 as a Percent of GDP Warren Buffett’s favorite valuation metric remains high despite the recent sell-off. Image: Morgan Stanley Wealth Management
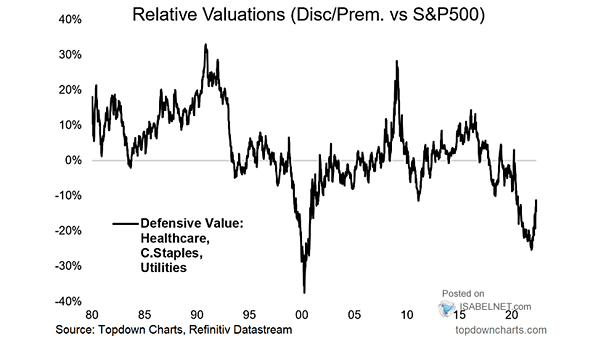
Relative Valuations – Defensive Value vs. S&P 500 Defensive value continues to outperform and looks cheaper than the S&P 500. Image: Topdown Charts
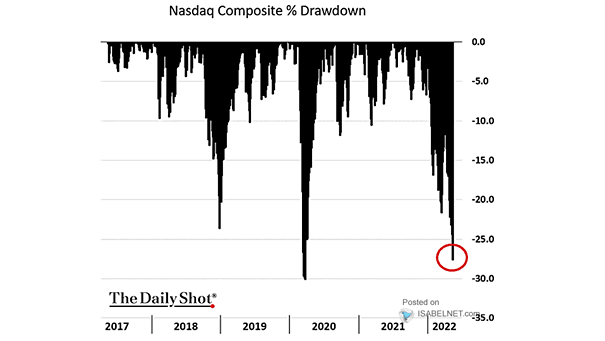
Nasdaq Composite Drawdown The Nasdaq Index is now in a 27% drawdown. Image: The Daily Shot
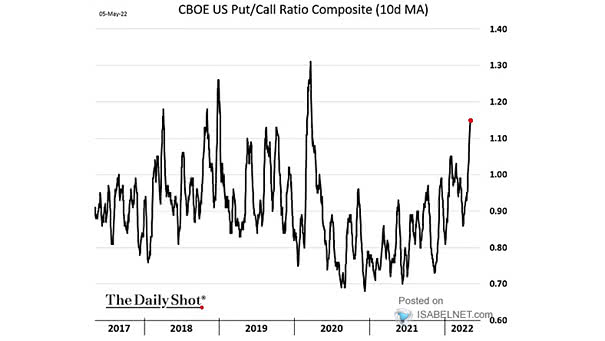
Sentiment – CBOE U.S. Put/Call Ratio Composite The U.S. put/call ratio is trading at relatively high levels, which is contrarian bullish. Image: The Daily Shot
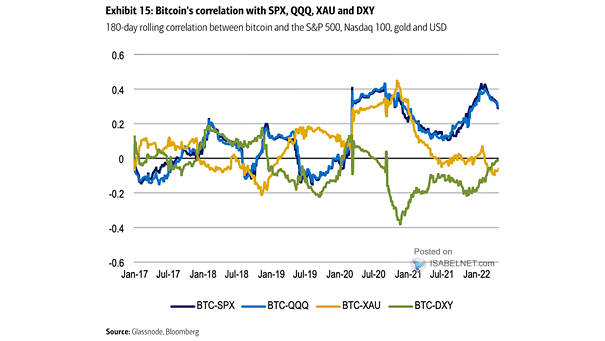
180-Day Rolling Correlation Between Bitcoin and the S&P 500, Nasdaq 100, Gold and U.S. Dollar The price of Bitcoin remains positively correlated to U.S. stocks. Image: BofA Global Research
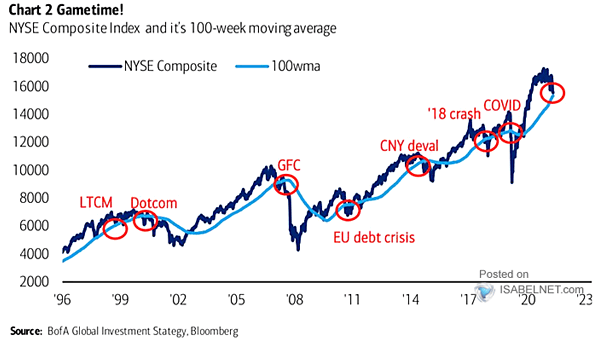
NYSE Composite Index and 100-Week Moving Average Will the NYSE Composite break its 100-week moving average to the downside significantly? Image: BofA Global Investment Strategy
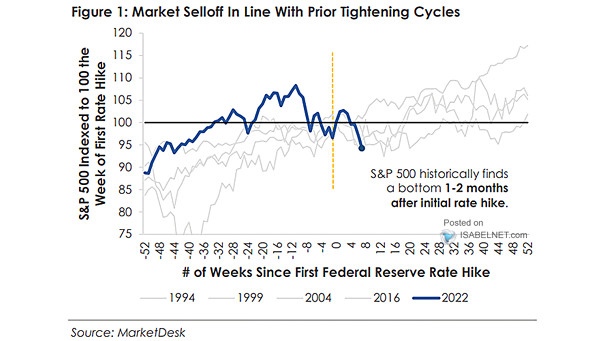
S&P 500 and First Fed Rate Hike Is the bottom near for U.S. stocks? Image: MarketDesk Research
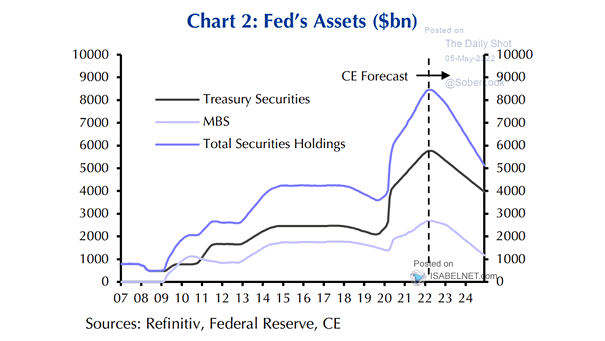
Fed’s Assets The Fed plans to shrink its balance sheet over time. What impact will this have on markets? Image: Capital Economics
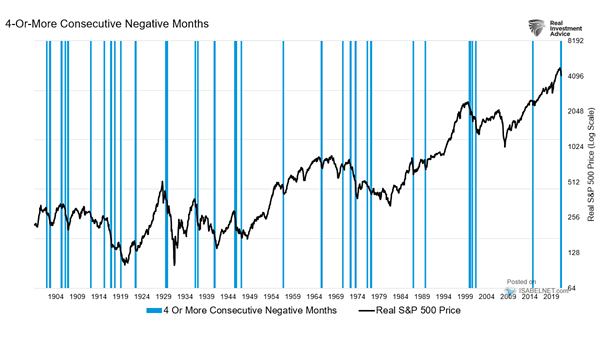
Real S&P 500 Price and 4-or-More Consecutive Negative Months Will the S&P 500 finish green in May? Image: Real Investment Advice