Correlation Between Commodities and the U.S. Dollar
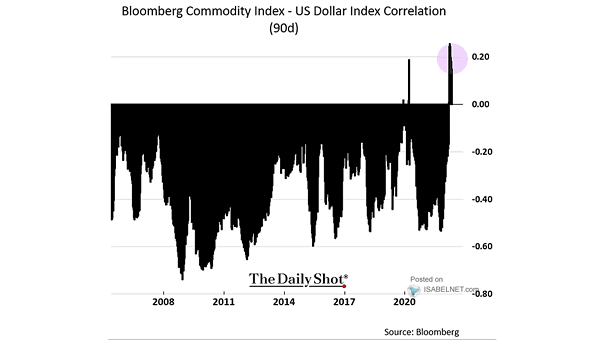
Correlation Between Commodities and the U.S. Dollar Normally, there is an inverse correlation between commodity prices and the U.S. dollar. Image: The Daily Shot
Correlation Between Commodities and the U.S. Dollar Normally, there is an inverse correlation between commodity prices and the U.S. dollar. Image: The Daily Shot
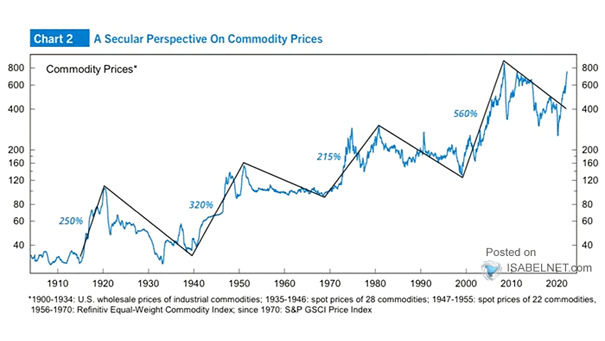
Commodities – Commodity Prices Is the spike in commodity prices a long-term secular bull market? Image: Alpine Macro
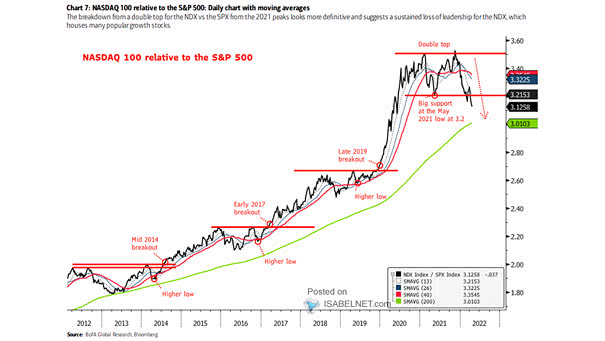
Nasdaq 100 Relative to the S&P 500 Will the Nasdaq 100 continue to underperform the S&P 500? Image: BofA Global Research
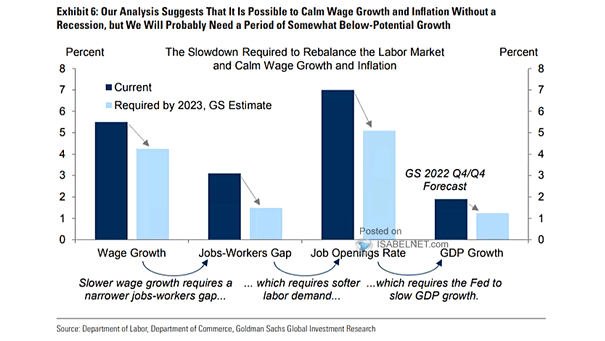
Recession – U.S. Labor Market, Wage Growth and GDP Would it be possible to avoid a recession in the United States? Image: Goldman Sachs Global Investment Research
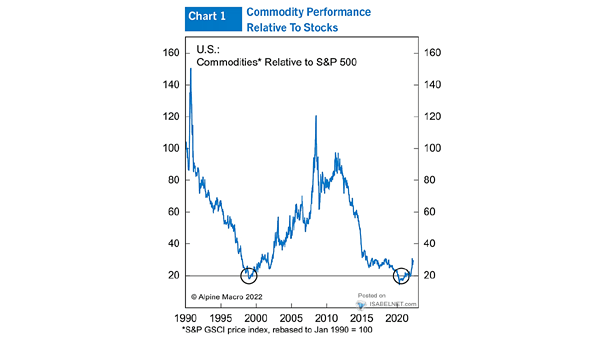
Commodities Relative to S&P 500 Will commodities continue to outperform U.S. stocks? Image: Alpine Macro
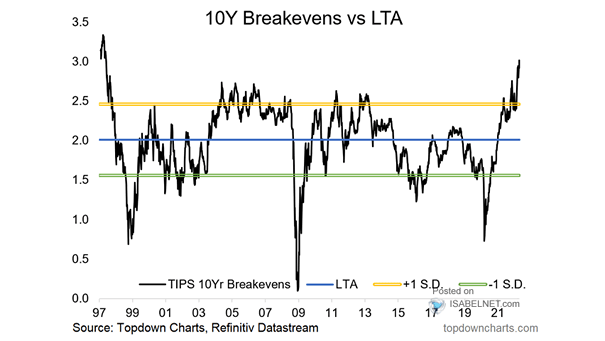
U.S. 10-Year Breakevens vs. Long Term Average Could 10-year breakevens increase further, as inflation fears continue to intensify? Image: Topdown Charts
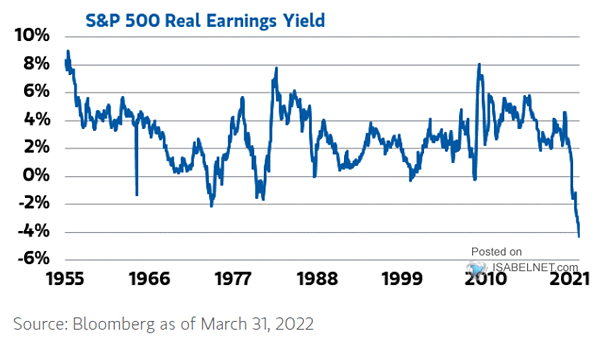
S&P 500 Index Real Earnings Yield The real earnings yield on U.S. stocks has never been lower. Image: Morgan Stanley Wealth Management
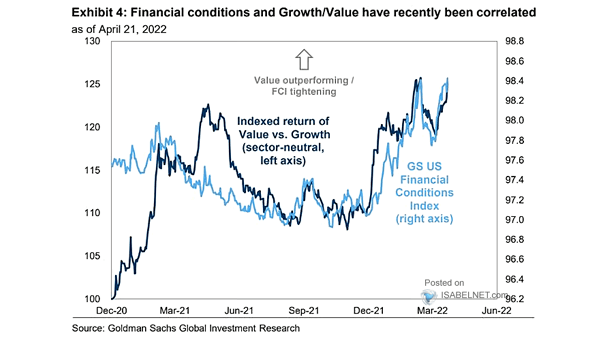
Indexed Return of Value vs. Growth vs. U.S. Financial Conditions Should investors still favor value over growth stocks? Image: Goldman Sachs Global Investment Research
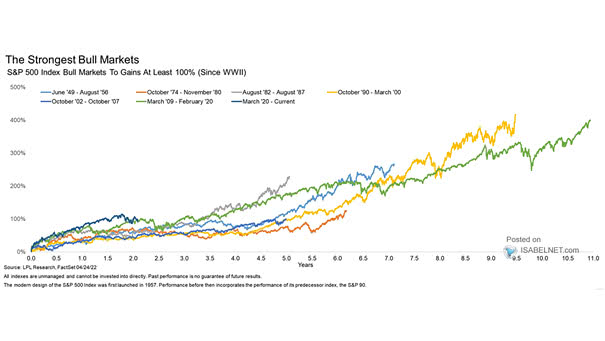
S&P 500 Index Bull Markets to Double Despite the recent sell-off, the current bull market remains one of the strongest ever. Image: LPL Research
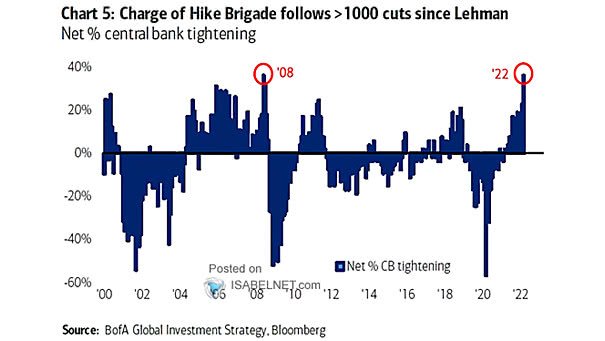
Net Percentage of Central Banks Tightening More central banks are hiking rates to compensate for rising inflation. Image: BofA Merrill Lynch Global Investment Strategy
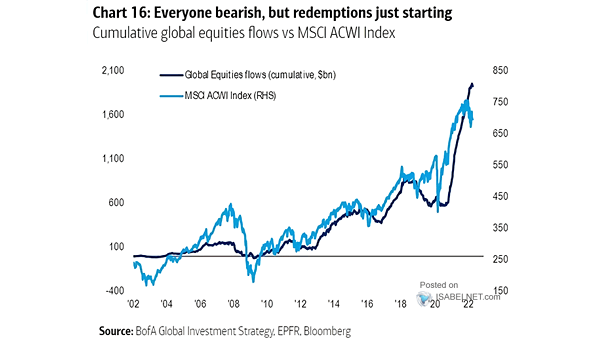
Cumulative Global Equities Flows vs. MSCI ACWI Index Global equities just saw massive outflows of $17.5 billion. Image: BofA Global Investment Strategy