S&P 500 – 2008 vs. 2022
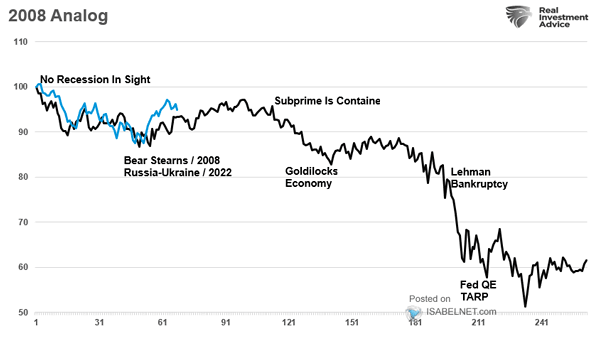
S&P 500 – 2008 vs. 2022 Is a recession coming in the United States? So far, the S&P 500 is tracking the 2008 analog. Image: Real Investment Advice
S&P 500 – 2008 vs. 2022 Is a recession coming in the United States? So far, the S&P 500 is tracking the 2008 analog. Image: Real Investment Advice
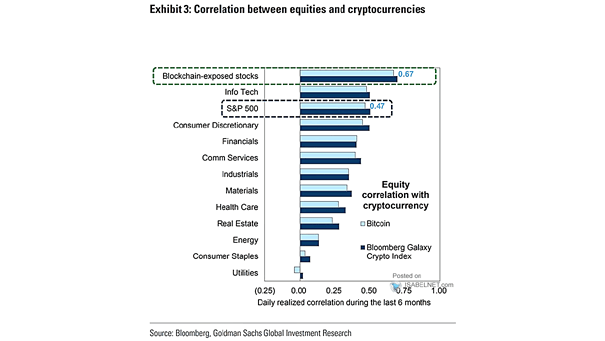
Bitcoin – Correlation Between Equities and Cryptocurrencies The S&P 500 and Bitcoin are increasingly correlated. Image: Goldman Sachs Global Investment Research
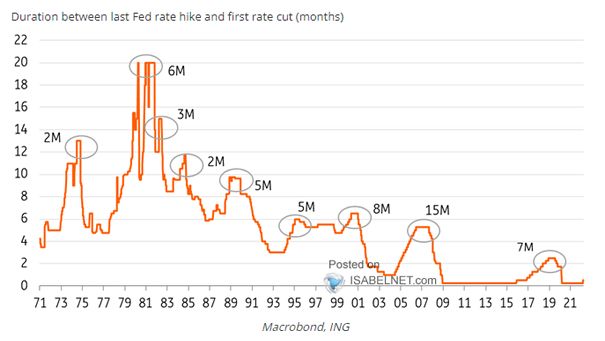
Interest Rates – Duration Between Last Fed Rate Hike and First Rate Cut (Months) Could the Fed cut rates in 2023 to avoid a recession? Image: ING Economics
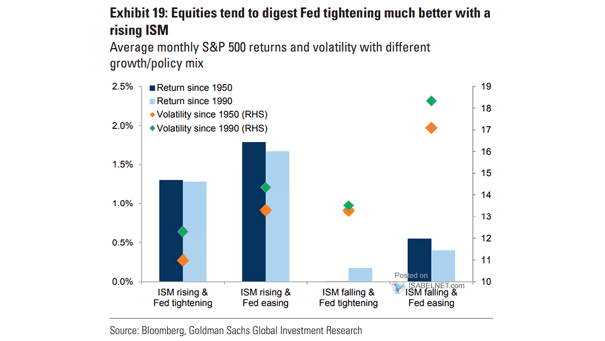
Average Monthly S&P 500 Returns and Volatility with Different Growth/Policy Mix Should U.S. equity investors expect anemic monthly returns this year? Image: Goldman Sachs Global Investment Research
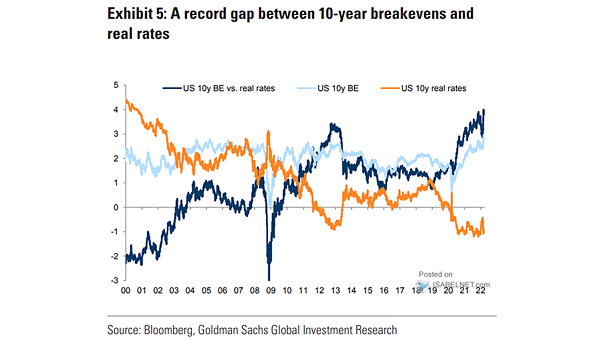
U.S. 10-Year Breakeven Inflation Rate vs. U.S. 10-Year Real Rate As stagflation is a growing threat to the U.S. economy, will the Fed maintain a loose policy? Image: Goldman Sachs Global Investment Research
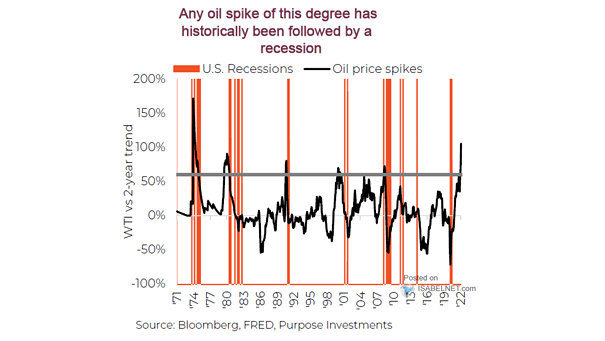
Oil Price Spikes and U.S. Recessions Historically, sharp increases in oil prices have preceded recessions in the United States. Image: Richardson Wealth
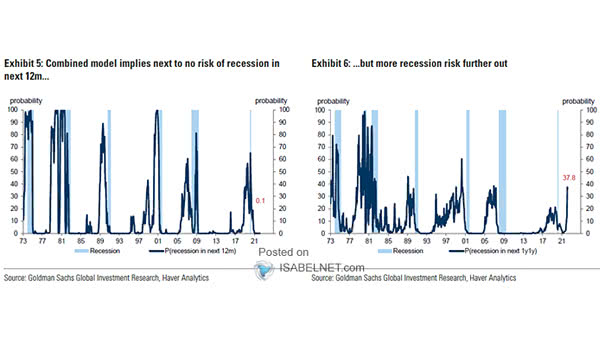
U.S. Recession Probability Goldman Sachs model shows that U.S. recession risks are rising. Image: Goldman Sachs Global Investment Research
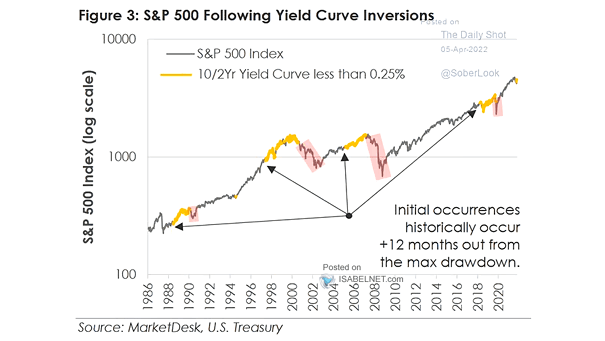
S&P 500 Index and 10Y-2Y Yield Curve Less Than 0.25% Historically, the inversion of the 10Y-2Y yield curve is not an immediate sell signal for U.S. stocks. Image: MarketDesk Research
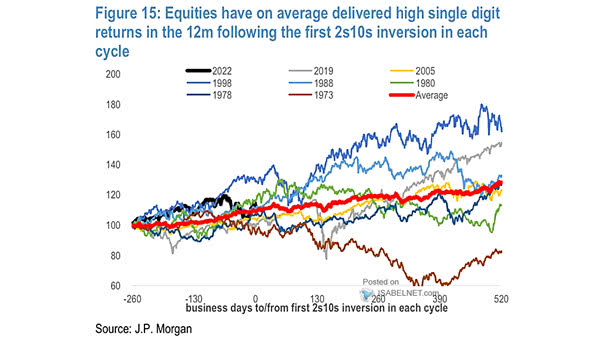
Yield Curve – U.S. Equity Returns in the 12-Months Following the First 10Y-2Y Inversion in Each Cycle Will the S&P 500 hit a new record high this year, despite the 10Y-2Y inverted yield curve? Image: J.P. Morgan
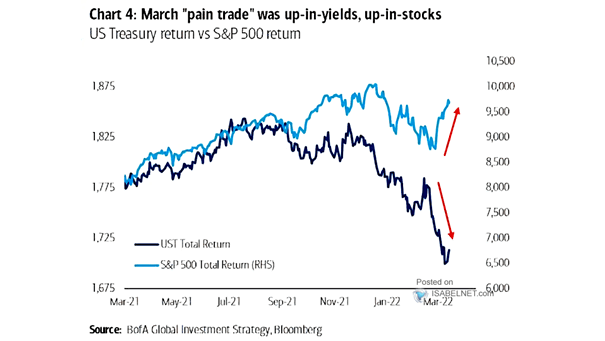
U.S. Treasury Return vs. S&P 500 Return Is the pain trade still U.S. stocks and UST yields higher? Image: BofA Global Investment Strategy
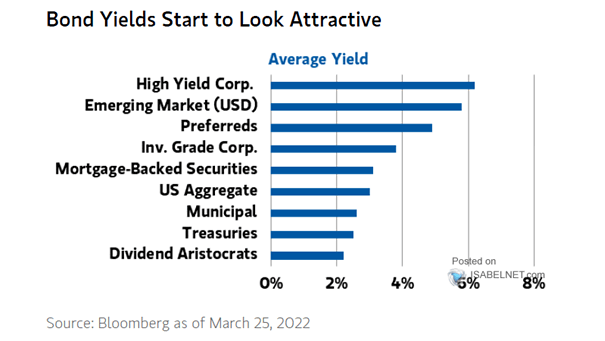
Average Yield Bond yields are up and look attractive. Image: Morgan Stanley Wealth Management