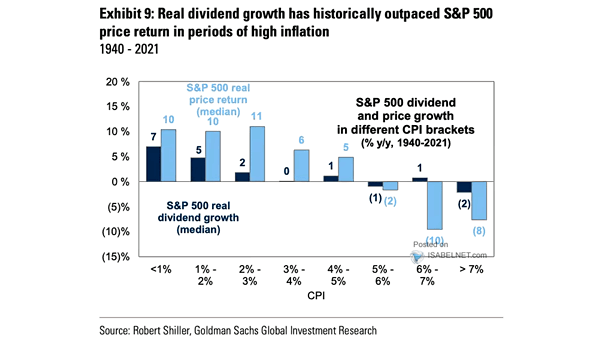
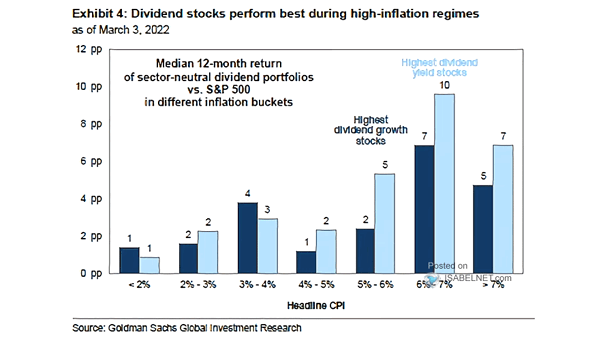
Post-GFC Fed Balance Sheet Phases, Fed Funds, UST 10-Year and the S&P 500
Post-GFC Fed Balance Sheet Phases, Fed Funds, UST 10-Year and the S&P 500 Can U.S. stocks survive the Fed’s tapering and rate hikes? Image: Deutsche Bank
U.S. Dollar Broad Trade Weighted Index Surrounding FED Tightening Cycles Will the U.S. dollar weaken after the Fed starts tightening monetary policy? Image: Deutsche Bank
Returns – Years Following S&P 500 Price Gain > 27% Since WWII, when the S&P 500 is up more than 27% at the end of the year, the following year tends to be bullish for U.S. stocks. Image: Fundstrat Global Advisors, LLC
Valuation – S&P 500 Forward P/E Around First Fed Hikes Historically, the S&P 500 forward P/E remains flat around first Fed hiking cycles. Image: Goldman Sachs Global Investment Research
EM Stocks – Chinese Stock Prices Relative to EM Should investors expect a rebound in Chinese stocks? Image: Alpine Macro
Fed Funds and Balance Sheet Contraction vs. S&P 500 How will the S&P 500 perform in 2022 with the Fed’s policy changes? Image: Real Investment Advice
Buybacks – S&P 500 Index Return Decomposition Share buybacks account for a large portion of the total return of the S&P 500 Index. Image: True Insights
Valuation – Dow Jones U.S. REIT U.S. REITs look expensive vs. history. Will U.S. REITs continue to outperform U.S. stocks in 2022? Image: Topdown Charts
Federal Funds Target Rate vs. Atlanta Fed Median Wage Growth Is the Fed behind the curve on wage growth? Image: Morgan Stanley Wealth Management
U.S. Real GDP and Labor Force Is slower economic growth in the United States the new normal? Image: Alpine Macro
Earnings – S&P 500 EPS Growth Forecasts vs. Consensus Goldman Sachs expects S&P 500 earnings per share of $226 in 2022. Image: Goldman Sachs Global Investment Research