Daily Advance U.S. GDP Tracking Estimate
Daily Advance U.S. GDP Tracking Estimate Goldman Sachs lowered its U.S. GDP forecast for the first quarter to +1.5% (QoQ annual rate). Image: Goldman Sachs Global Investment Research
Daily Advance U.S. GDP Tracking Estimate Goldman Sachs lowered its U.S. GDP forecast for the first quarter to +1.5% (QoQ annual rate). Image: Goldman Sachs Global Investment Research
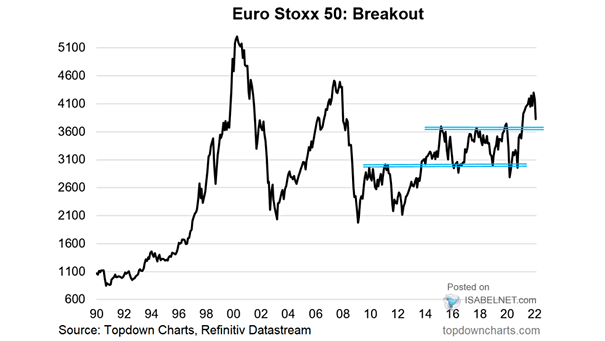
European Stocks – Euro Stoxx 50 Should investors still favor European equities despite the Russia-Ukraine conflict? Image: Topdown Charts
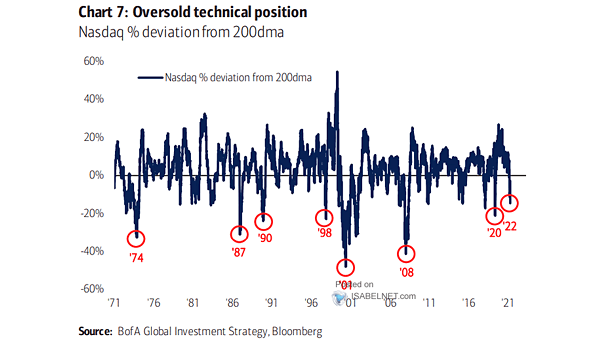
Nasdaq % Deviation from 200-Day Moving Average The Nasdaq is getting very oversold. Image: BofA Global Investment Strategy
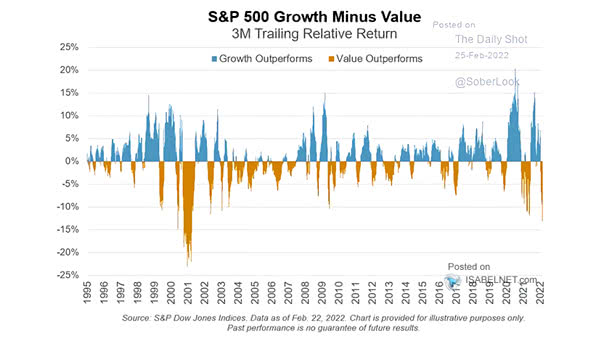
S&P 500 Growth Minus Value – 3-Month Trailing Relative Return Will value continue to outperform growth this year? Image: S&P Global Market Intelligence
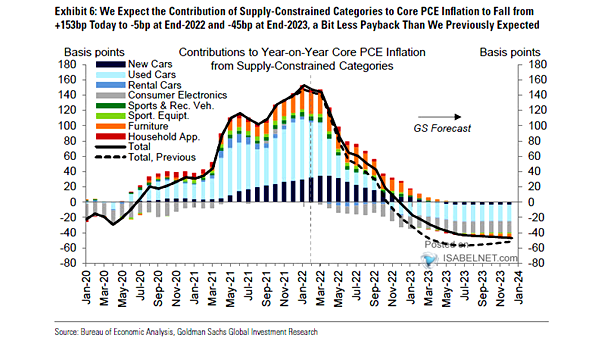
Contributions to YoY Core PCE Inflation from Supply-Constrained Categories The contribution to U.S. core PCE inflation from supply-contrained categories is expected to fall significantly this year. Image: Goldman Sachs Global Investment Research
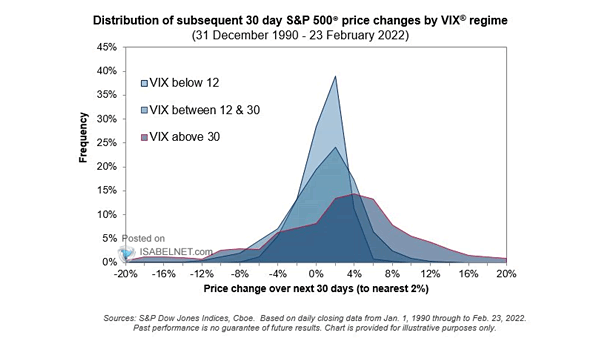
Distribution of Subsequent 30 Day S&P 500 Price Changes by VIX Regime VIX above 30 tends to be bullish for U.S. stocks, but tail risk increases. Image: S&P Global Market Intelligence
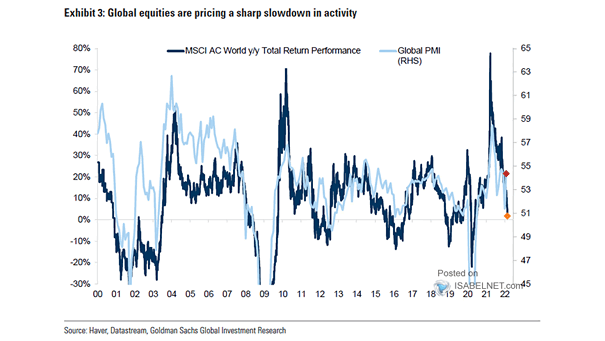
Global PMI and MSCI AC World YoY Total Return Performance Should investors expect a sharp slowdown in global activity? Image: Goldman Sachs Global Investment Research
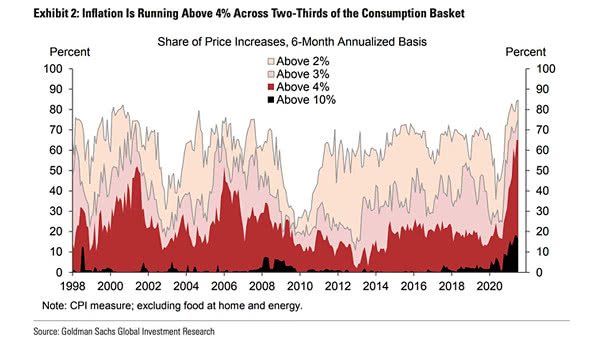
Inflation – Share of Price Increases, 6-Month Annualized Basis Inflation is running high but is expected to start decelerating. Image: Goldman Sachs Global Investment Research
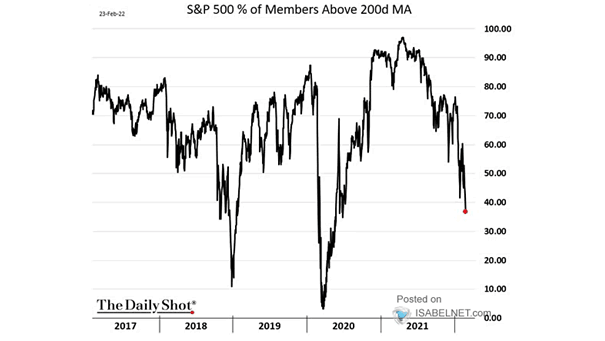
% of S&P 500 Stocks Above Their 200-Day Moving Average Can investors expect a relief rally in U.S. stocks? Image: The Daily Shot
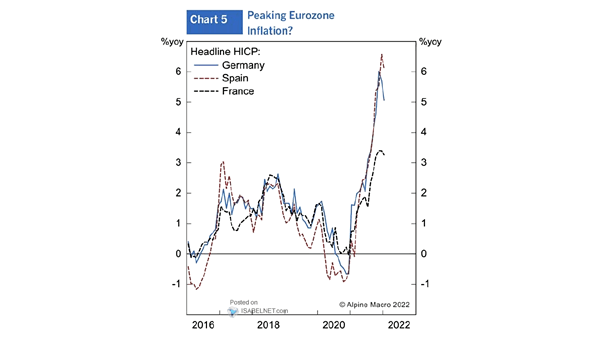
Inflation in the Euro Zone Has headline inflation peaked in the euro zone? Image: Alpine Macro
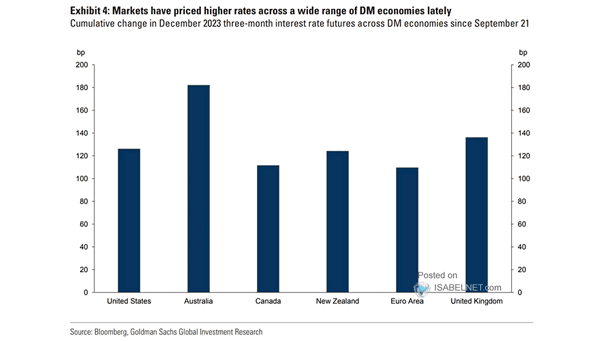
Cumulative Change in Three-Month Interest Rates Futures Across DM Economies Markets expect higher interest rates in several DM economies. Image: Goldman Sachs Global Investment Research