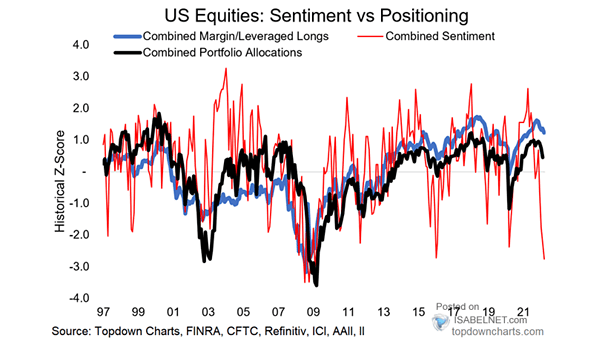
U.S. Equities – Sentiment vs. Positioning
U.S. Equities – Sentiment vs. Positioning Positioning remains on the bullish side. Is negative sentiment a contrarian bullish sign? Image: Topdown Charts
U.S. Equities – Sentiment vs. Positioning Positioning remains on the bullish side. Is negative sentiment a contrarian bullish sign? Image: Topdown Charts
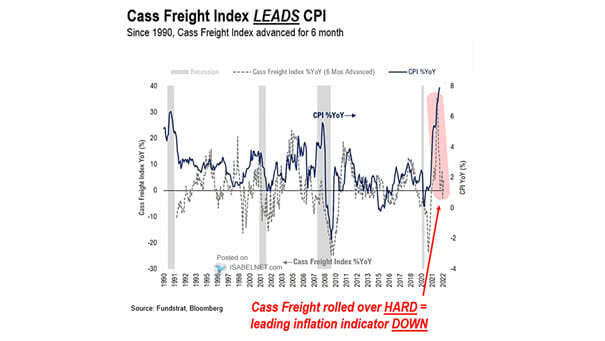
Inflation – U.S. CPI YoY and Cass Freight Shipments Index YoY (Leading Indicator) The Cass Freight Shipments Index suggests lower U.S. inflation in the second half of 2022. Image: Fundstrat Global Advisors, LLC
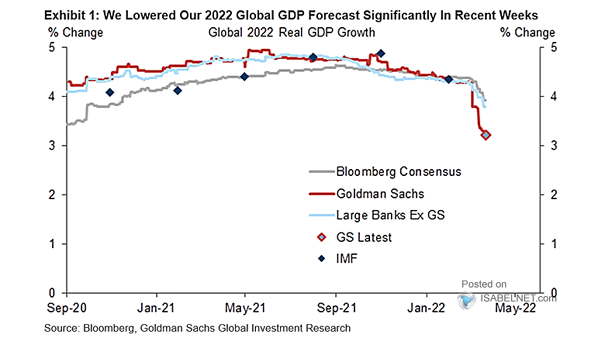
Global Real GDP Growth Goldman Sachs has significantly lowered its global GDP forecast for 2022. Image: Goldman Sachs Global Investment Research
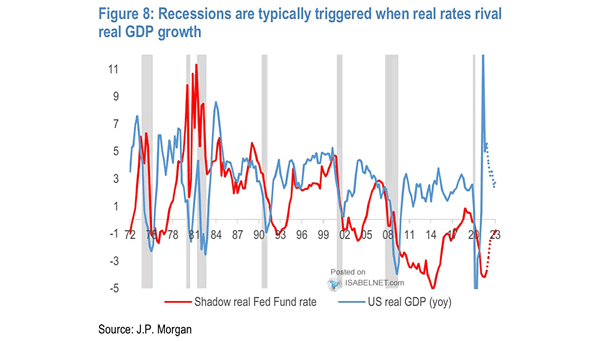
U.S. Recessions – Shadow Real Fed Funds Rate and U.S. Real GDP Historically, U.S. recessions tend to begin when the real fed funds rate exceeds real GDP growth. Image: J.P. Morgan
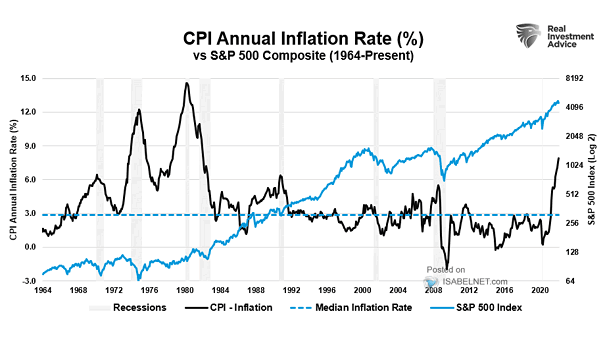
CPI Annual Inflation Rate vs. S&P 500 Composite Historically, periods of high inflation do not bode well for the S&P 500. Image: Real Investment Advice
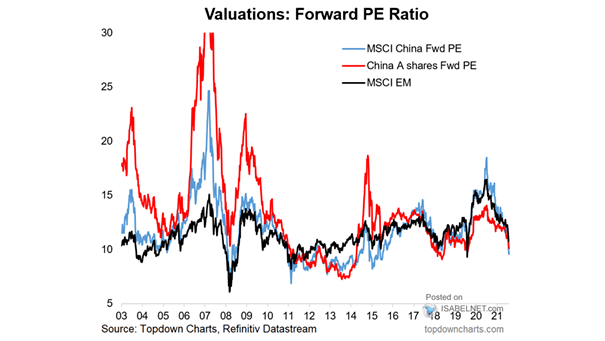
Valuations – MSCI China Forward PE Ratio and MSCI EM The valuation of the China equity market looks attractive again. Image: Topdown Charts
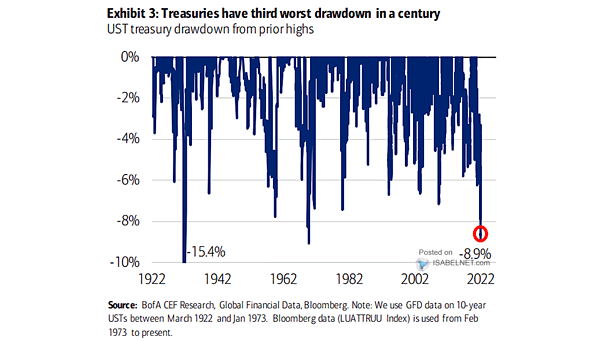
U.S. Treasury Drawdown from Prior Highs Will the U.S. bond market continue to sell off? Image: BofA CEF Research
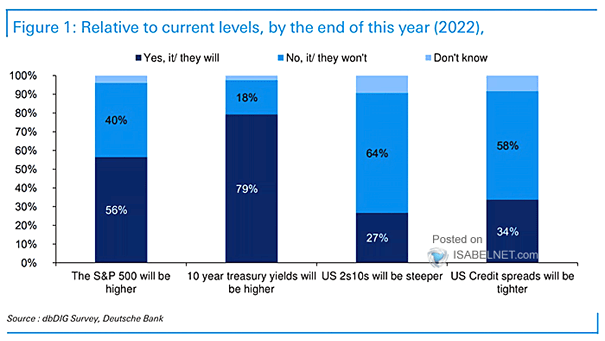
Relative to Current Levels, by the End of this Year… S&P 500, 10-Year UST Yields, 10Y-2Y Yield Curve, Credit Spreads Will the S&P 500 and U.S. 10-year Treasury yields be higher by the end of this year? Image: Deutsche Bank
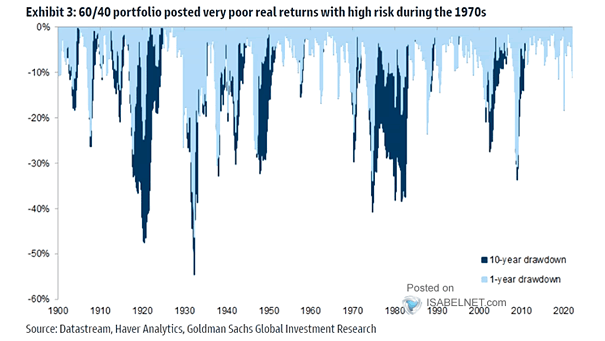
60/40 Portfolio Real Returns A period of stagflation does not bode well for 60/40 portfolios. Image: Goldman Sachs Global Investment Research
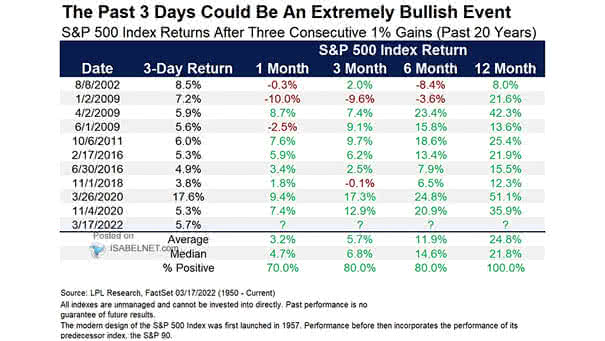
S&P 500 Index Returns After Three Consecutive 1% Gains The performance of the S&P 500 this week suggests that the bull market is not over yet. Image: LPL Research
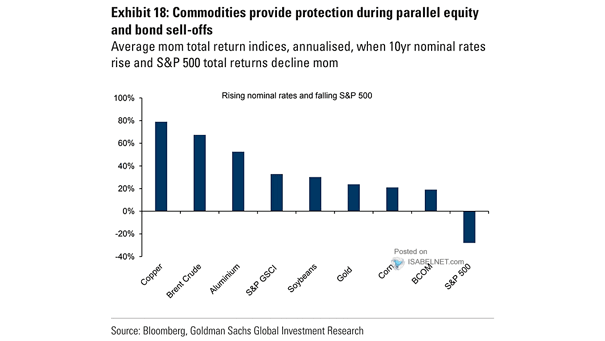
Returns – Rising Nominal Rates and Falling S&P 500 Should investors continue to favor commodities? Image: Goldman Sachs Global Investment Research