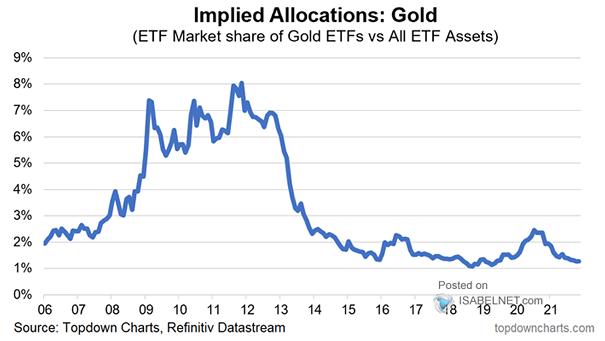
Yield Gap – S&P 500 EPS Yield vs. U.S. 10-Year Treasury Yield
Yield Gap – S&P 500 EPS Yield vs. U.S. 10-Year Treasury Yield Relative U.S. equity valuations are still attractive vs. history. Image: Goldman Sachs Global Investment Research
Consumer Confidence Index vs. S&P 500 Does consumer confidence improve or do equities fall? Image: Piper Sandler
S&P 500 Drawdowns – Fastest Recovery in History from 2-Sigma This year, the S&P 500’s average recovery time of 4.6 days is at the lowest level since 1928. How long can this last? Image: BofA Global Research
S&P 500 – Duration Between Two 3%+ Drawdowns Is the U.S. stock market poised for a bigger drawdown before the end of the year? Image: Deutsche Bank Global Asset Allocation
Valuation – Cyclically-Adjusted P/E Why are U.S. equities more expensive than other developed markets? Image: BCA Research
Net % Overweight Equities vs. Global PMI Momentum Global PMI momentum is expected to turn negative over the coming months. Image: BofA Global Research
S&P 500 Futures and 50-Day Moving Average Morgan Stanley remains bearish on the U.S. stock market for this fall. Image: Morgan Stanley Research
1000-Point Milestone for the Dow Jones Industrial Average So far, the sun shines on the U.S. stock market. But historically, market exuberance does not end well. Image: Real Investment Advice
U.S. Household Debt Payments – Financial Obligations Ratio The ratio of U.S. household debt payments to disposable income is at all-time lows. Image: BofA Global Research
University of Michigan Long-Run Inflation Expectations Will long-run inflation expectations remain in the comfort zone? Image: BofA Global Research
European vs. Global Equities Projections European equities are expected to underperform global equities over the next 12 months. Image: BofA Global Research