S&P 500 – 100 Days in “Consolidation” YTD
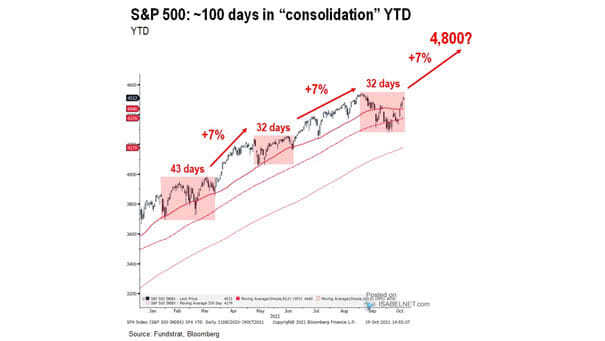
S&P 500 – 100 Days in “Consolidation” YTD Could a risk-on rally lead the S&P 500 to 4,800 by the end of the year? Image: Fundstrat Global Advisors, LLC
S&P 500 – 100 Days in “Consolidation” YTD Could a risk-on rally lead the S&P 500 to 4,800 by the end of the year? Image: Fundstrat Global Advisors, LLC
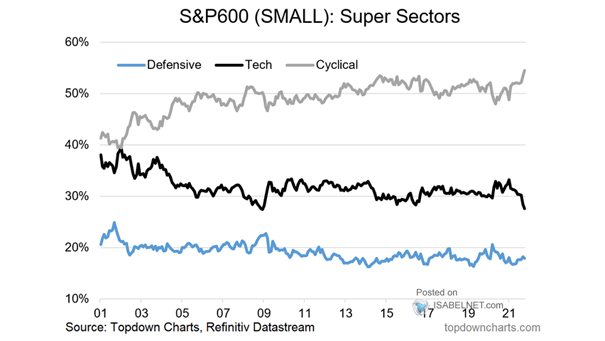
U.S. Small Cap Stocks – S&P 600 Super Sectors Will U.S. cyclicals continue to outperform tech stocks as rates rise? Image: Topdown Charts
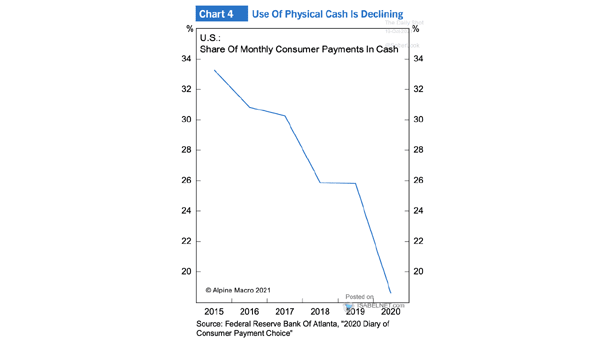
Share of Monthly Consumer Payments in Cash in the U.S. The coronavirus pandemic has accelerated the decline in cash payments in the United States. Image: Alpine Macro
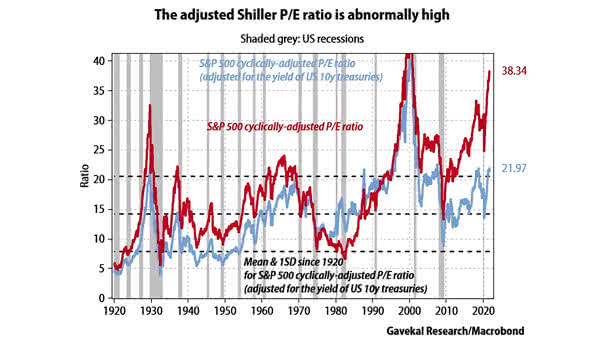
Valuation – S&P 500 Cyclically-Adjusted P/E Ratio Should investors take a cautious approach to U.S. equities as the S&P 500’s cyclically-adjusted P/E ratio remains elevated? Image: Gavekal, Macrobond
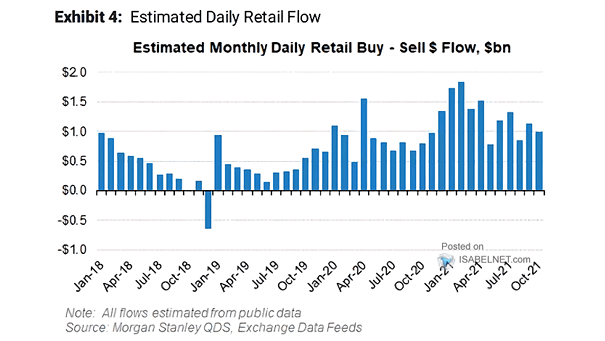
Estimated Monthly Daily Retail Buy – Sell $ Flow Will retail investors remain committed to buying stocks, especially on down days? Image: Morgan Stanley Quantitative and Derivative Strategies
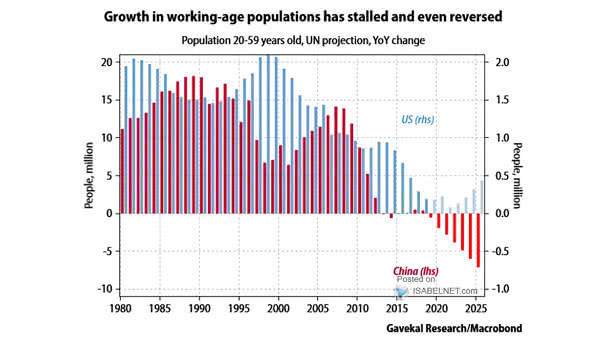
U.S. vs. China – Population 20-59 Years Old Shrinking working-age populations in the U.S. and China could alter growth prospects. Image: Gavekal, Macrobond
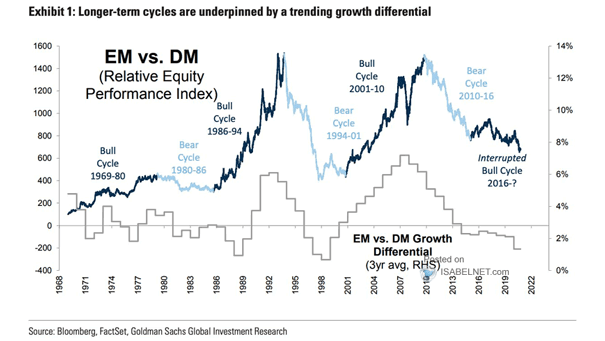
Emerging Markets vs. Developed Markets Growth Differential The growth cycle usually drives emerging markets. Image: Goldman Sachs Global Investment Research
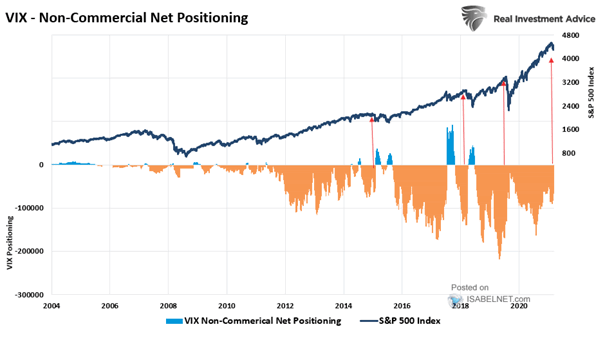
VIX Non-Commercial Net Positioning Net shorts on the VIX remain elevated. Are speculators too complacent? Image: Real Investment Advice
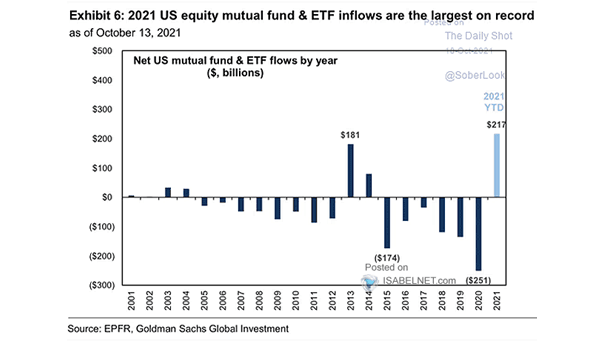
Net U.S. Mutual Fund and ETF Flows by Year Are flows into U.S. equity mutual funds and ETFs on the way to the moon this year? Image: Goldman Sachs Global Investment Research
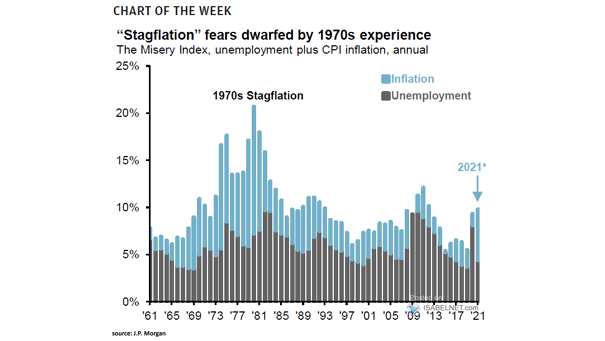
The Misery Index – Unemployment plus CPI Inflation The Misery Index is nowhere near its 1970s level. Are stagflation fears overblown? Image: J.P. Morgan Asset Management
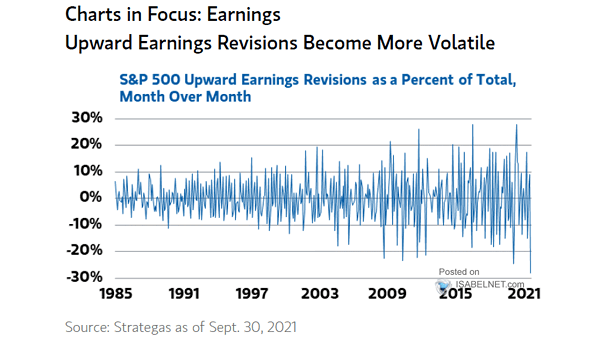
S&P 500 Upward Earnings Revisions as a Percent of Total Will upward earnings revisions become even more volatile? Image: Morgan Stanley Wealth Management