S&P 500 Performance on Friday the 13th since 1928
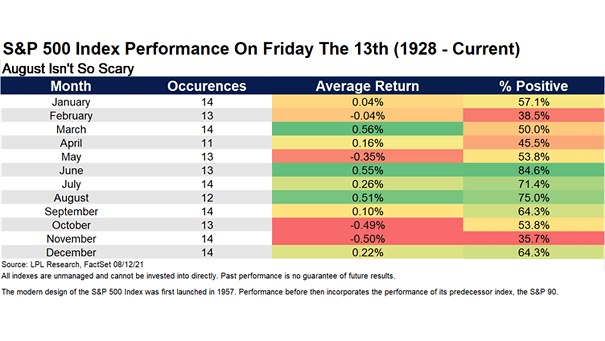
S&P 500 Performance on Friday the 13th since 1928 Historically, U.S. stocks tend to do well on Friday the 13th in August. Image: LPL Research
S&P 500 Performance on Friday the 13th since 1928 Historically, U.S. stocks tend to do well on Friday the 13th in August. Image: LPL Research
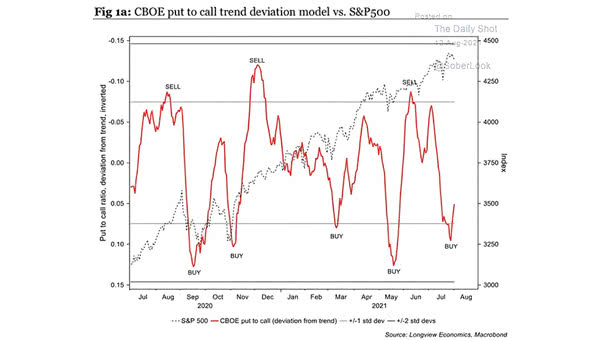
Put to Call Trend Deviation Model vs. S&P 500 The put to call ratio (deviation from trend) is still bullish for the S&P 500. Image: Longview Economics

Top Five Companies as Share of S&P 500 Total The S&P 500 remains abnormally concentrated. Facebook, Apple, Amazon, MicroSoft and Google (Alphabet) account for 22% of S&P 500 market capitalization. Image: Goldman Sachs Global Investment Research
China 10-Year Government Bond Yield and USD/CNY (Leading Indicator) China 10-year government bond yield tends to lead USD/CNY by 3 months. Image: Alpine Macro
Stocks – GRANOLAS Dividend Yield and German 10-Year Bond Yield Europe does not have the FAAMGs, but it has the GRANOLAS (Glaxosmithkline, Roche, ASML, Nestle, Novartis, Novo Nordisk, L’Oreal, LVMH, Astrazeneca, SAP and Sanofi). Image: Goldman Sachs Global Investment Research
Inequality – U.S. Households’ Share of Excess Savings U.S. households’ excess savings are going to the wealthy. Could excess savings drive the U.S. stock market higher? Image: Oxford Economics
Correction – S&P 500 and Marshallian K With U.S. GDP growing faster than M2 money supply, the S&P 500 is vulnerable to a correction. Image: Bloomberg
Annual Inflation-Adjusted Return Forecasts for the Next Seven Years Should investors expect anemic real returns over the next 7 years? Image: Financial Times
S&P 500 vs. Daily Trading Sentiment Composite The NDR daily trading sentiment composite is neutral. How high will the S&P 500 climb by year-end? Image: Ned Davis Research
S&P 500 and Deviation Above 200-Day Moving Average The S&P 500 index is currently more than 11% above its 200-day moving average. Is a market correction on the horizon? Image: Real Investment Advice
S&P 500 and U.S. M2 Minus Bank Credit (Leading Indicator) U.S. M2 minus bank credit tends to lead the S&P 500 by 6 months. Image: Alpine Macro