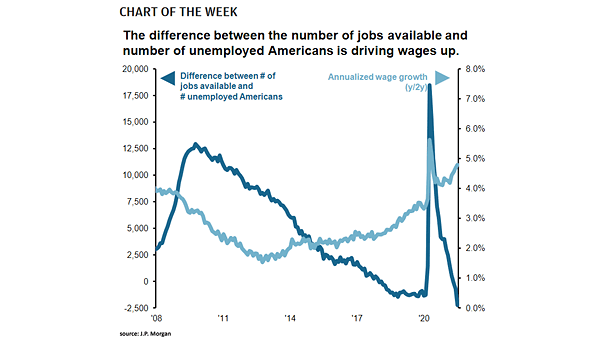
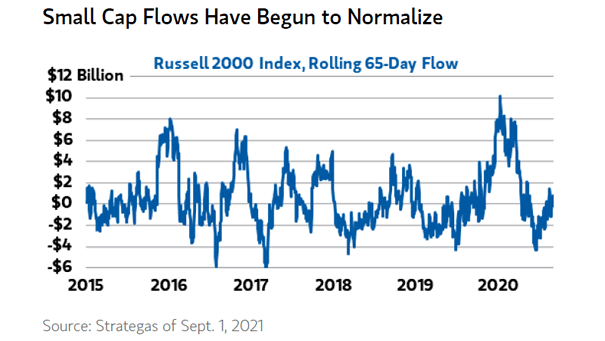
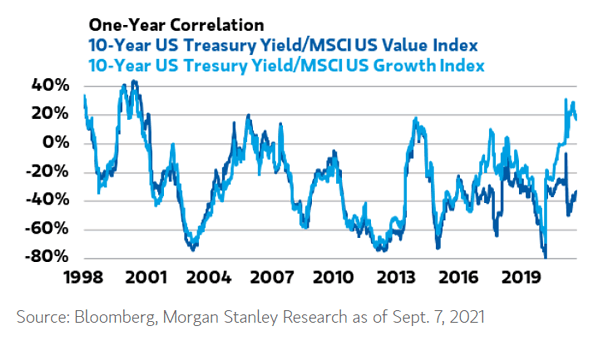
U.S. 10-Year Treasury Yield Estimates
U.S. 10-Year Treasury Yield Estimates While U.S. stocks rise to all-time highs, U.S. 10-year Treasury yield estimates are stalling. Image: BofA Global Investment Strategy
S&P 500 for the Past 6 Months The longer the quiet period, the more violent the volatility and fluctuations in the market. Image: Richardson Wealth
Active vs. Passive ETFs Will actively managed ETFs continue to shine in 2021? Image: Bloomberg
Euro Area and U.S. Inflation and Central Bank Forecasts The Fed projects U.S. inflation well above 2% into 2023. Image: BlackRock Investment Institute
Valuation – IPOs with Negative Earnings Per Share and Price/Earnings Ratio Is the U.S. stock market facing a dotcom bubble 2.0? Image: Morgan Stanley Wealth Management
S&P 500 Index and Exponential Trend Line Investors should expect a reversion to the mean, as it is highly likely that the gap between the S&P 500 Index and the exponential trend line will close eventually. Image: Real Investment Advice
Stock Correlations with Treasury Yields and HY Spreads The correlation between stocks and Treasury yields has broken down since the Pfizer/BioNTech vaccine announcement, while the relationship with HY spreads has remained stable. Image: Credit Suisse
Fed – Timeline for Tapering and Change in Nonfarm Payrolls Should the market be braced for a formal taper announcement in December 2021? Image: Goldman Sachs Global Investment Research
Seasonality in Markets Seasonality suggests that the S&P 500 tends to move lower over the next few months. Image: BCA Research
S&P 500 Index – Number of 10% Corrections Per Year 10% corrections are fairly common for the S&P 500 Index. Since 1950, there has been an average of one per year. Image: LPL Research
Gold to Silver Ratio The gold to silver ratio is an interesting indicator at its extremes. Image: Morgan Stanley Research