S&P 500 – Number of Closing Highs
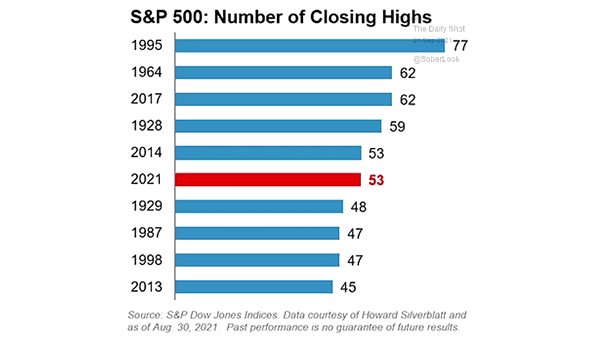
S&P 500 – Number of Closing Highs Will the S&P 500 break the all-time record of 77 new highs this year? Image: S&P 500 Dow Jones Indices
S&P 500 – Number of Closing Highs Will the S&P 500 break the all-time record of 77 new highs this year? Image: S&P 500 Dow Jones Indices
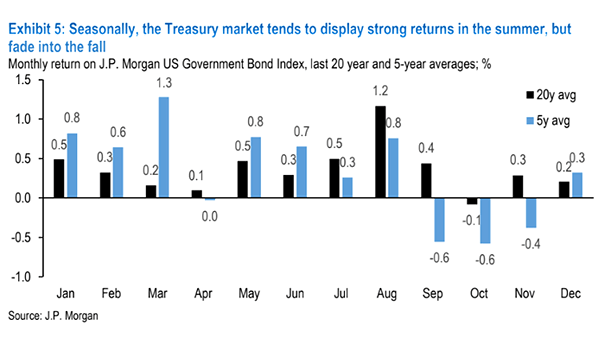
Seasonality – U.S. Treasury Market Historically, the U.S. Treasury market tends to fade into the fall. Image: J.P. Morgan
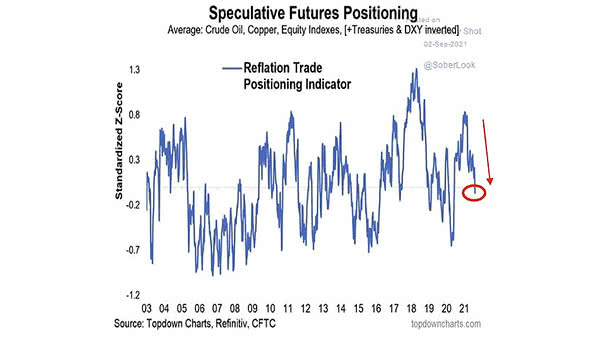
Reflation Trade Positioning Indicator Is the reflation trade over? Image: Topdown Charts
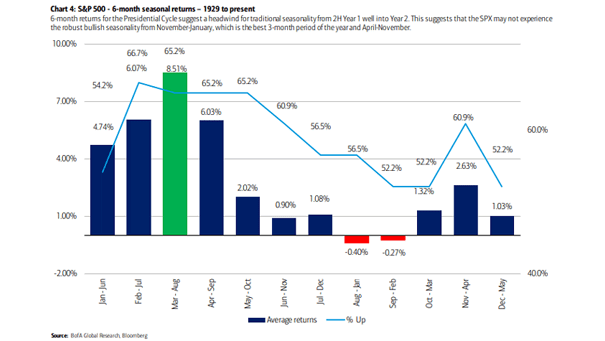
S&P 500 6-Month Seasonal Returns and Percentage of Time Up – Presidential Cycle Year 1 into Presidential Cycle Year 2 From Presidential cycle year 1 into Presidential cycle year 2, the S&P 500 has historically done poorly from September through February. Image: BofA Global Research
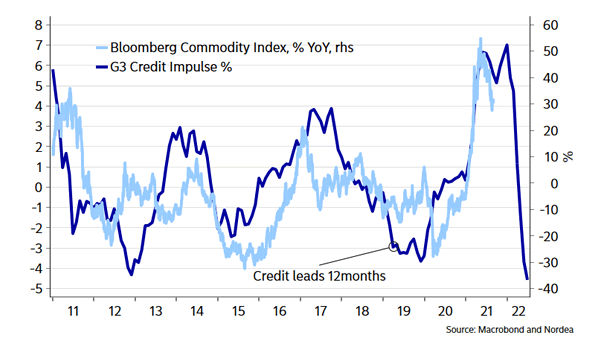
G3 Credit Impulse and Commodities (Leading Indicator) G3 credit impulse tends to lead commodity prices by 12 months. Image: Nordea and Macrobond
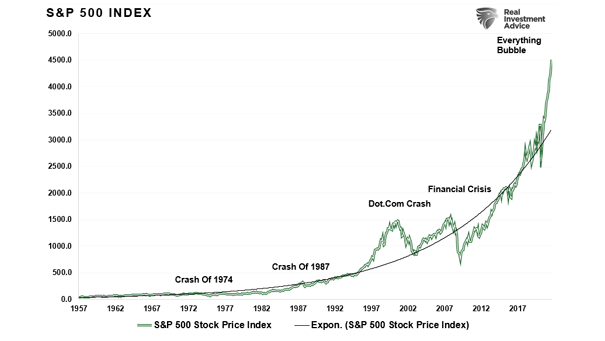
S&P 500 Index and Exponential Growth Trend Line Should investors worry that the S&P 500 Index is very extended from its exponential growth trend line? Image: Real Investment Advice
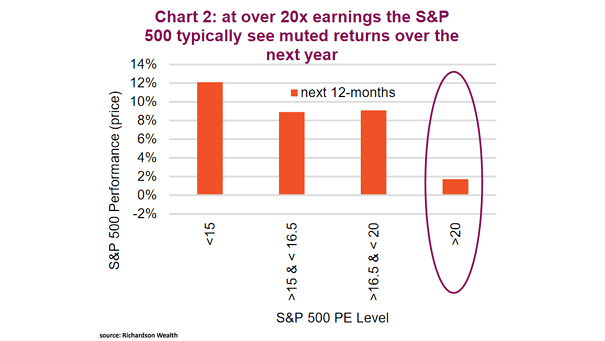
Returns – S&P 500 Performance and S&P 500 P/E Level Should investors expect low single digit return for the S&P 500 over the next year? Image: Richardson Wealth
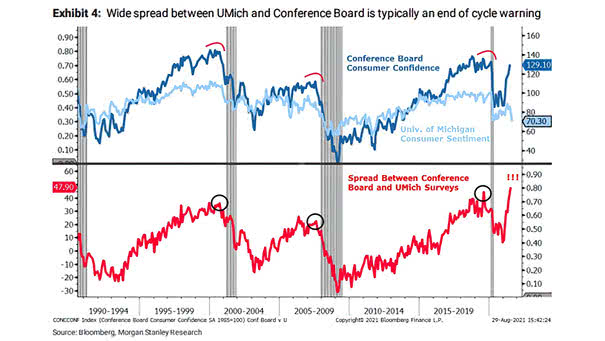
U.S. Cycle – Spread Between Conference Board Consumer Confidence and UMich Surveys Morgan Stanley expects a “mid-cycle transition”, with a 10%-plus correction for the U.S. stock market. Image: Morgan Stanley Research

Treasury Securities – Supply of Safe Haven Securities Will U.S. Treasury securities remain a safe haven? Image: BCA Research
S&P 500 Tracking 1980 Nikkei 225 Index Will the S&P 500 end up like the Nikkei 225 index in the 1990s? Image: Real Investment Advice
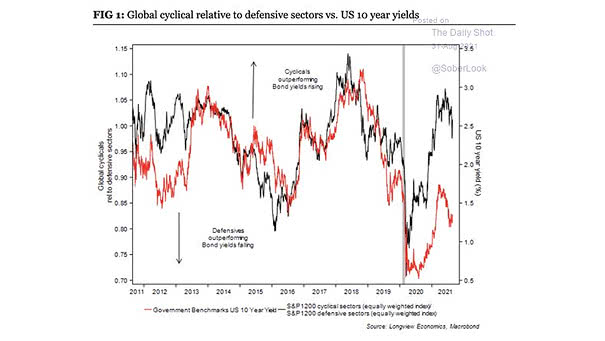
Stocks – Global Cyclical Relative to Defensive Sectors vs. U.S. 10-Year Yields Is now the time for defensive stocks? Image: Longview Economics