Velocity of M2 Money Stock in the U.S. vs. The U.S. Deficit
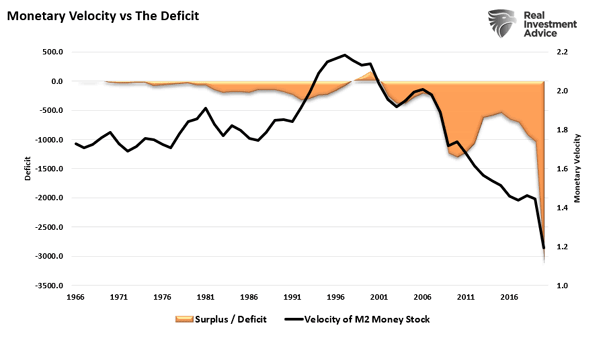
Velocity of M2 Money Stock in the U.S. vs. The U.S. Deficit The rise in the U.S. deficit has coincided with a collapse in M2 velocity. Image: Real Investment Advice
Velocity of M2 Money Stock in the U.S. vs. The U.S. Deficit The rise in the U.S. deficit has coincided with a collapse in M2 velocity. Image: Real Investment Advice
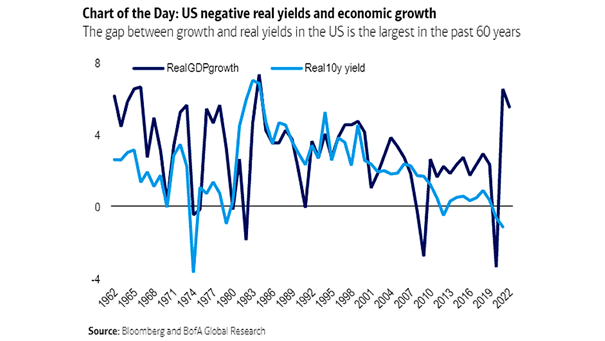
Real U.S. 10-Year Yield and U.S. Real GDP Growth Will U.S. real yields remain negative despite a strong U.S. economic recovery? Image: BofA Global Research
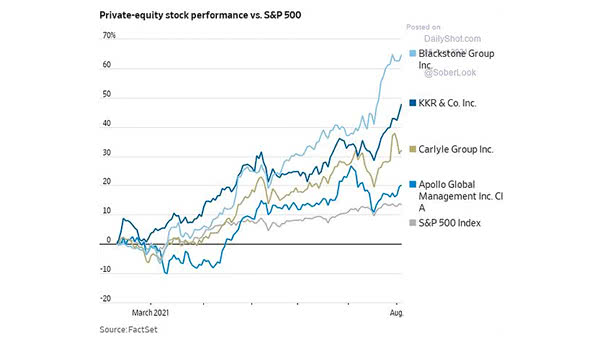
Private-Equity Stock Performance vs. S&P 500 Thanks to low interest rates, private equity returns are rising. Image: The Wall Street Journal
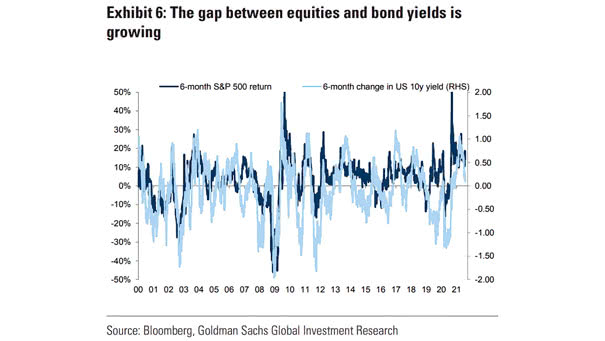
6-Month S&P 500 Return and 6-Month Change in U.S. 10-Year Yield The risk of a correction in U.S. equities is increasing. Image: Goldman Sachs Global Investment Research
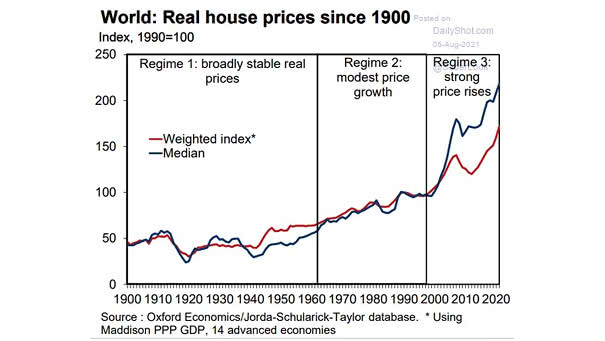
Housing – World Real House Prices Will the latest global housing boom end well? Image: Oxford Economics
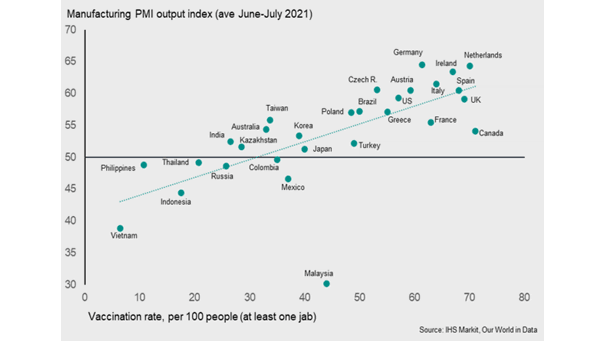
Coronavirus – Manufacturing PMI Output Index and COVID-19 Vaccination Rate COVID-19 vaccination rates tend to drive economic growth. Image: IHS Markit
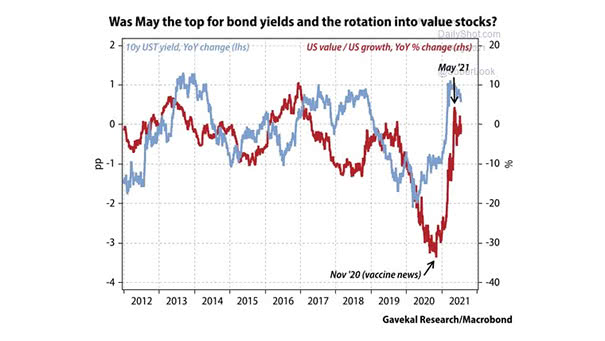
Value Stocks – U.S. 10-Year Treasury Yield and U.S. Value / U.S. Growth Is the value rotation in the U.S. stock market over? Image: Gavekal, Macrobond
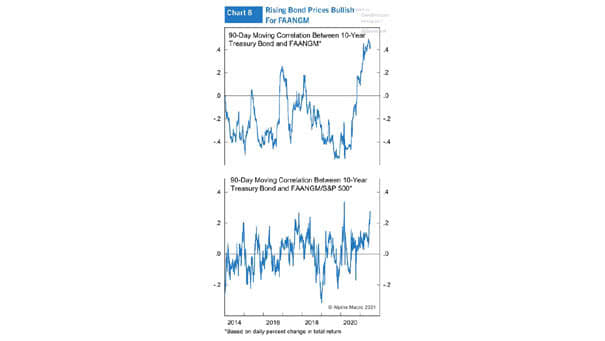
90-Day Moving Correlation Between U.S. 10-Year Treasury Bond and FAANGM Stocks Rising bond prices tend to be bullish for FAANGM stocks. Image: Alpine Macro
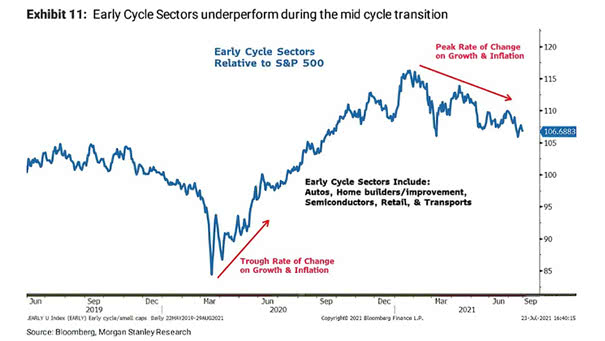
Performance – Early Cycle Sectors Relative to S&P 500 Should investors continue to underweight early cycle sectors during the mid cycle transition? Image: Morgan Stanley Research
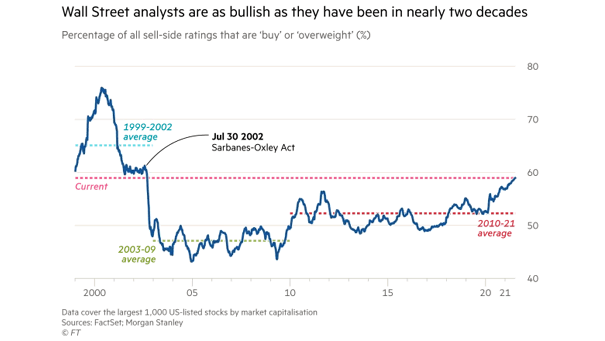
U.S. Stocks – Percentage of All Sell-Side Ratings That Are Buy or Overweight Wall Street analysts are very bullish on U.S. stocks. Image: Financial Times
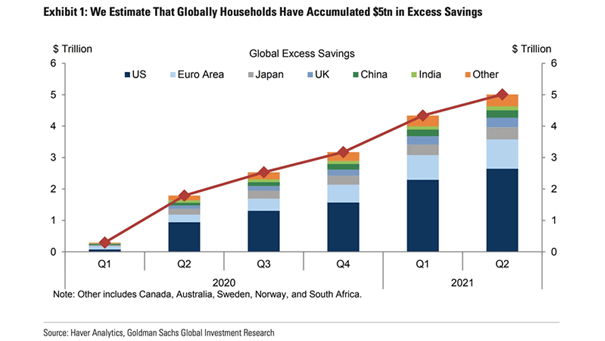
Households – Global Excess Savings Could excess savings drive global stock markets higher? Image: Goldman Sachs Global Investment Research