% of Large-Cap Mutual Funds Outperforming their Benchmarks

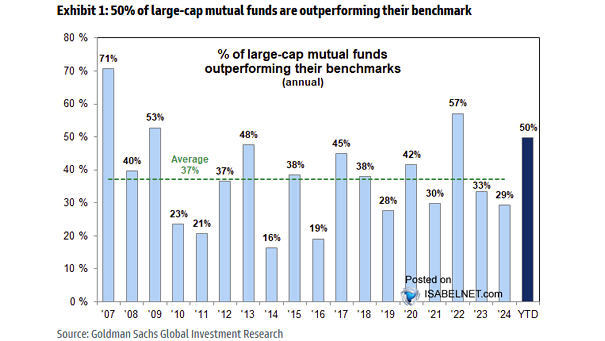
% of Large-Cap Mutual Funds Outperforming their Benchmarks Active large-cap funds are enjoying an early win, with 57% topping their benchmarks so far this year, well above the average of 37%. But if history is any guide, keeping that edge will be tough. Image: Goldman Sachs Global Investment Research

Relative Equity Market Performance – USA vs. Rest of the World

Relative Equity Market Performance – USA vs. Rest of the World U.S. equities have lagged global peers recently, posting their steepest relative underperformance in 15 years. The leadership baton has passed to cheaper, more cyclical markets overseas, pointing to brighter days for the global cycle. Image: Deutsche Bank Research

U.S. Equities – Net Portfolio Equity Flows

U.S. Equities – Net Portfolio Equity Flows Investors can’t seem to get enough of U.S. stocks. Net inflows in 2025 topped an amount equal to about 2% of GDP, an intensity the market hasn’t seen in years. Clearly, investors still see plenty of upside in U.S. equities. Image: Deutsche Bank

U.S. ISM Manufacturing and Services Survey Data

U.S. ISM Manufacturing and Services Survey Data Economists call it a “soft recession” when factories slow but services keep humming. That resilience on the services side is what kept the U.S. out of a recession. But if services begin to crack, things could shift quickly. Image: Real Investment Advice

Estimated Exposure to AI Automation

Estimated Exposure to AI Automation Investors are punishing U.S. sectors most exposed to AI‑driven automation, betting that vulnerable business models will struggle to keep pace, despite steady fundamentals. Automation’s shockwaves are reshaping entire sectors. Image: Goldman Sachs Global Investment Research

Congressional Budget Office Forecast of 10-Year U.S. Treasury Yield

Congressional Budget Office Forecast of 10-Year U.S. Treasury Yield The Congressional Budget Office sees the 10-year U.S. Treasury yield edging higher over the next few years as swelling federal debt puts upward pressure on borrowing costs. Deficits have a price. Image: Deutsche Bank

S&P 500 Four Month Range

S&P 500 Four Month Range The S&P 500 has spent four months drifting in a tight range, the kind of calm that rarely lasts. Which way it breaks is anyone’s guess, but as traders like to say, don’t short a dull market. Image: Carson Investment Research

Estimated Wealth Effects on Annualized Real PCE Growth

Estimated Wealth Effects on Annualized Real PCE Growth Should stocks stumble, the positive wealth effect supporting consumption may turn into a headwind during the second half of 2026. After all, consumer sentiment is definitely tied to market performance. Image: Goldman Sachs Global Investment Research

Share of Russell 3000 Firms Discussing Layoffs During Quarterly Earnings Calls

Share of Russell 3000 Firms Discussing Layoffs During Quarterly Earnings Calls You won’t hear much about layoffs on earnings calls these days, a hint that management still sees blue skies for growth. Talk of job cuts usually comes when profit margins start to thin. For now, steady headcount says it all. Image: Goldman Sachs Global…

Weight of TMT in the S&P 500

Weight of TMT in the S&P 500 At 37% of S&P 500 earnings, Information Technology and Communication Services remain the market’s driving force, with the trend still pointing higher. Hard to bet against tech when it’s carrying that much weight. Image: Goldman Sachs Global Investment Research

S&P 500 Index Returns in February

S&P 500 Index Returns in February The S&P 500 tends to lose a bit of steam as February winds down, with the final days often trending softer. Nobody likes it, but few are really surprised. Image: Carson Investment Research