MSCI World Around Bear Markets
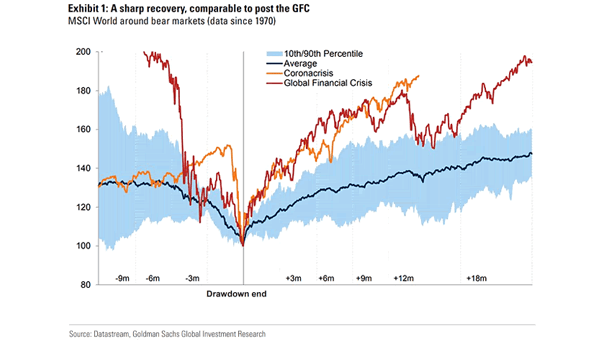
MSCI World Around Bear Markets After the shortest, and one of the sharpest bear markets in history, the MSCI World recovery is still better than post-GFC. Image: Goldman Sachs Global Investment Research
MSCI World Around Bear Markets After the shortest, and one of the sharpest bear markets in history, the MSCI World recovery is still better than post-GFC. Image: Goldman Sachs Global Investment Research
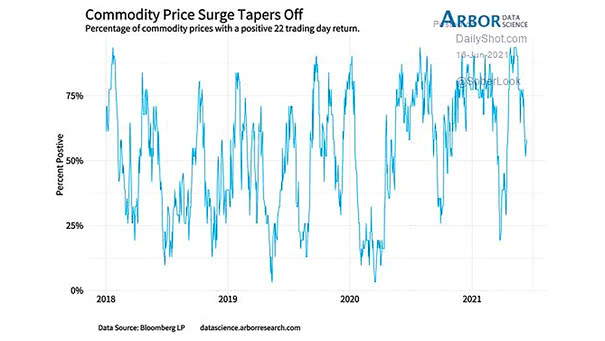
Commodities – Percentage of Commodity Prices with a Positive 22 Trading Day Return Should investors rethink investing in commodities? Image: Arbor Research & Trading LLC
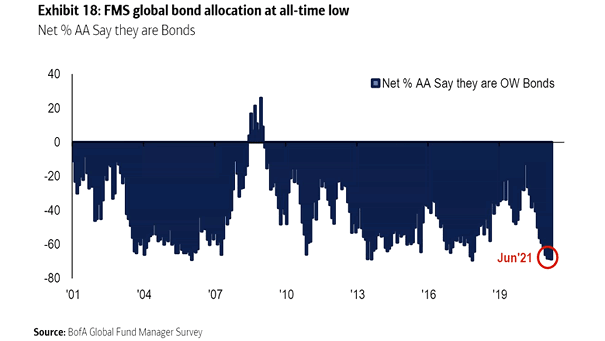
FMS Global Bond Allocation FMS global bond allocation is now at its lowest level in three years, at -69%. Image: BofA Global Fund Manager Survey
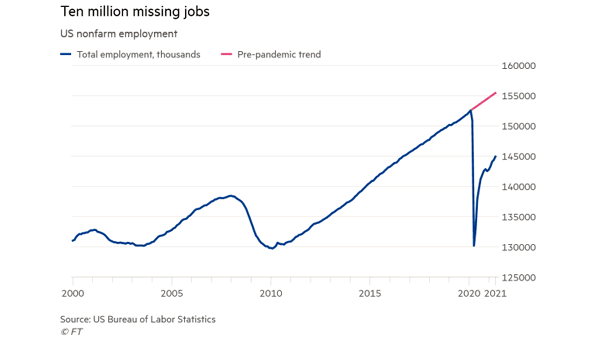
U.S. Jobs – U.S. Nonfarm Employment Is the labor market running hot? 10 million jobs are still missing in the United States. Image: Financial Times
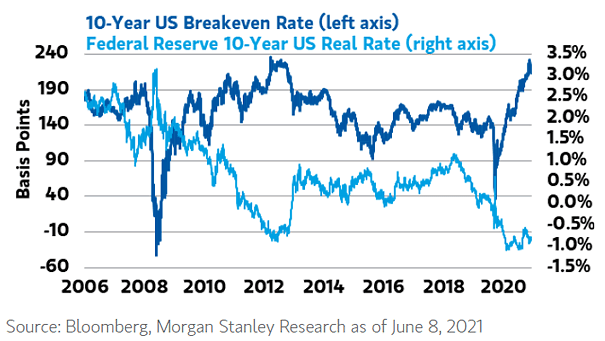
Rates – 10-Year U.S. Breakeven Rate and Federal Reserve 10-Year U.S. Real Rate Should investors be worried about the risk of rising U.S. real rates? Image: Morgan Stanley Wealth Management
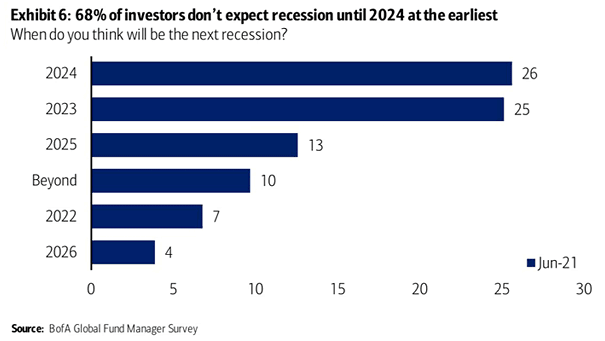
When Do You Think Will Be the Next Recession? Should investors expect a recession in 2024 at the earliest? Image: BofA Global Fund Manager Survey
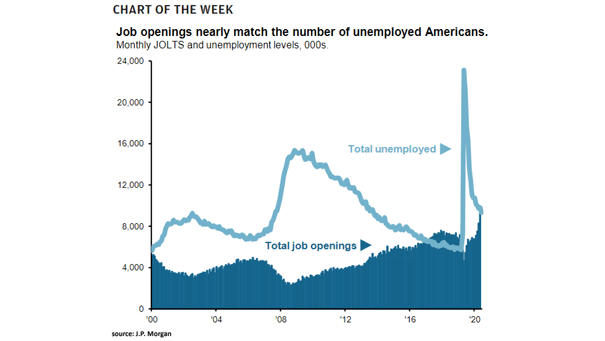
Jobs – Monthly JOLTS and U.S. Unemployment Rate Some Americans are earning more money from unemployment benefits than they do working their job. Image: J.P. Morgan Asset Management
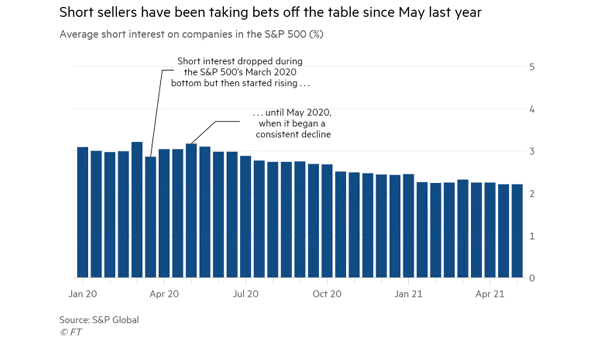
Average Short Interest on Companies in the S&P 500 Sign of optimism or complacency? Short interest on companies in the S&P 500 continues to decline. Image: Financial Times
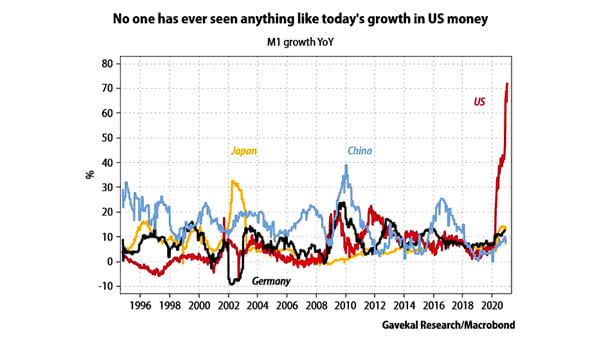
M1 Money Supply Growth YoY The M1 money supply in the United States has grown faster than any time in history. Image: Gavekal, Macrobond
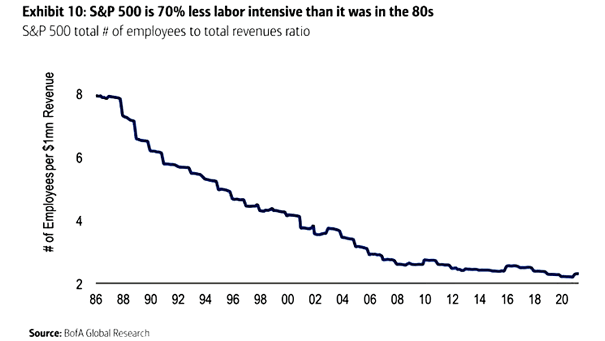
S&P 500 Total Number of Employees to Total Revenues Ratio In 1986, it took 8 employees to generate US$1 million in revenue. Today, the S&P 500 is 70% less labor intensive than it was in the 80s. Image: BofA Global Research

Inflation – Annualized 3-Month Headline CPI Change Has U.S. headline inflation peaked? Image: BofA Global Investment Strategy