Inflation – Annualized 3-Month Core CPI Change
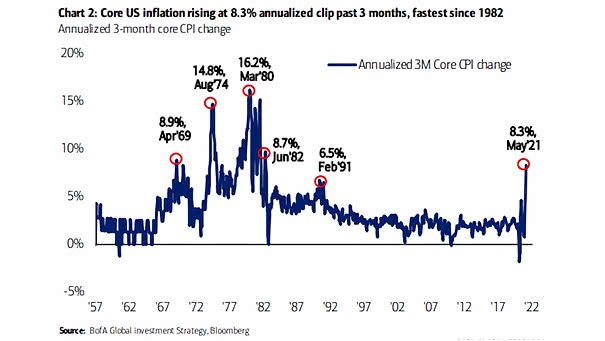
Inflation – Annualized 3-Month Core CPI Change Has U.S. core inflation peaked? Image: BofA Global Investment Strategy
Inflation – Annualized 3-Month Core CPI Change Has U.S. core inflation peaked? Image: BofA Global Investment Strategy
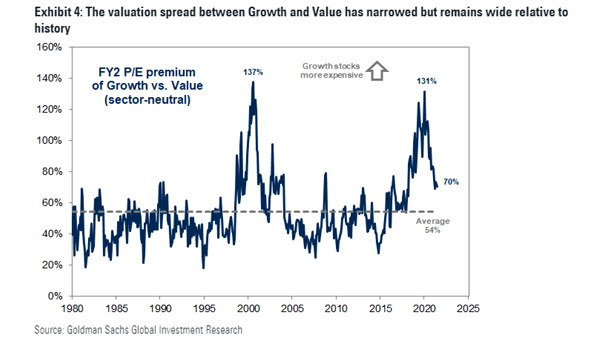
Valuation – FY2 P/E Premium of Growth vs. Value The valuation spread between Growth and Value is still well above its long-term average. Image: Goldman Sachs Global Investment Research
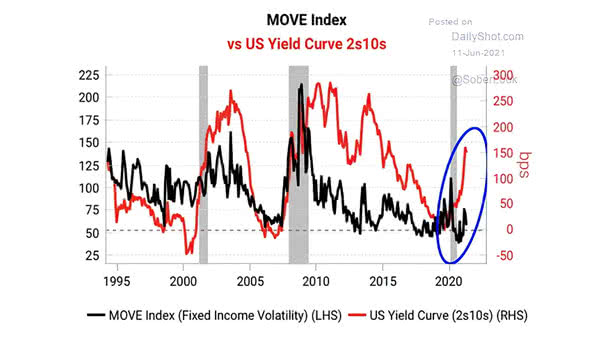
MOVE Index vs. U.S. 10Y-2Y Yield Curve Should investors expect a steeper yield curve and more fixed-income volatility? Image: Variant Perception Research
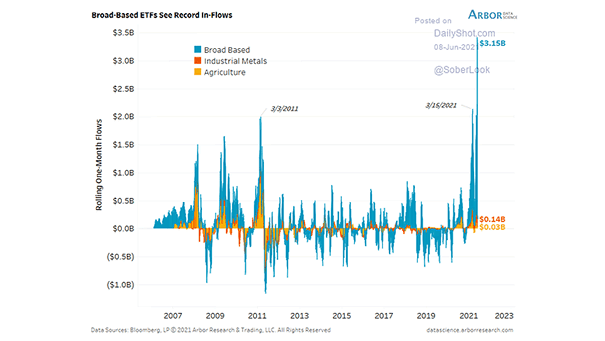
Flows – Broad Commodity ETFs Flows into broad commodity ETFs are massive this year. Image: Arbor Research & Trading LLC
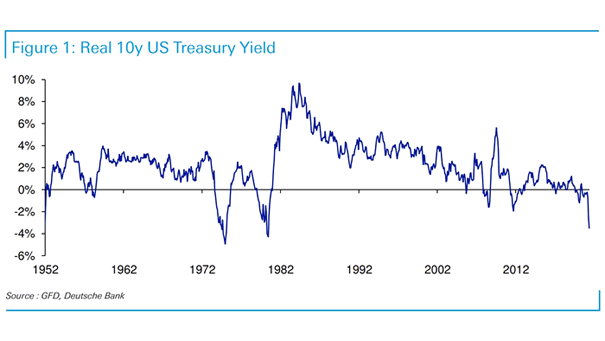
Real 10-Year U.S. Treasury Yield Has the real 10-year U.S. Treasury yield bottomed out? Image: Deutsche Bank
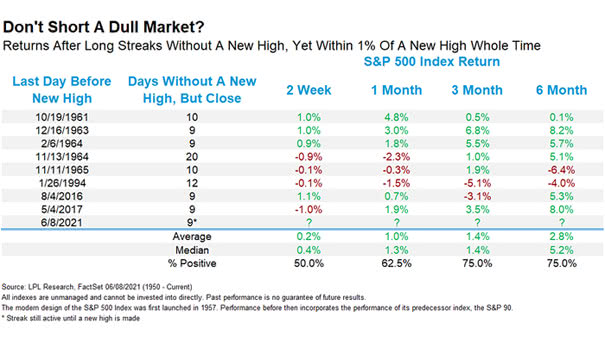
Returns After Long Streaks Without A New High, Yet Within 1% Of A New High Whole Time Experienced stock traders tend to never short a dull market. Image: LPL Research
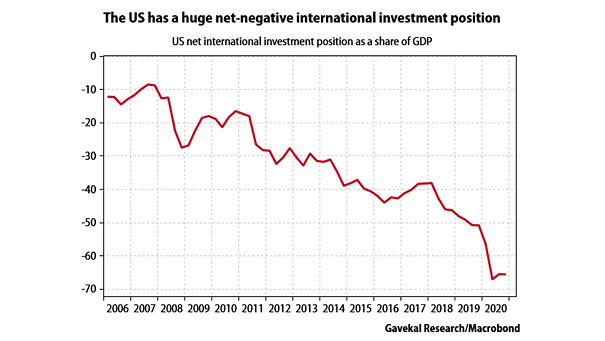
U.S. Net International Investment Position (NIIP) as a Share of GDP Is the U.S. net international investment position (NIIP) a cause of concern? Image: Gavekal, Macrobond
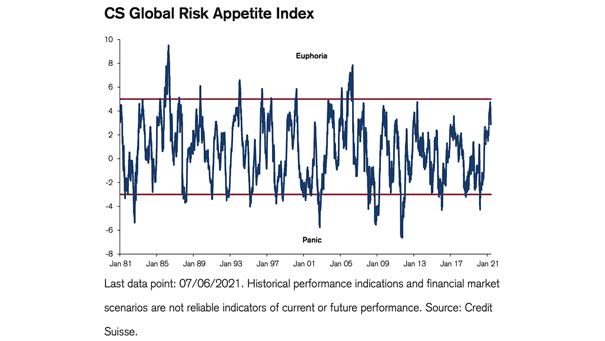
Sentiment – Global Risk Appetite Index The global risk appetite index remains positive, but is drifting down. Image: Credit Suisse Research
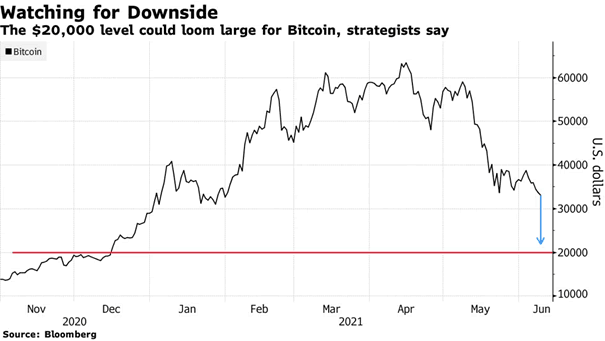
Bitcoin – Downside Target Is there more downside for Bitcoin? Image: Bloomberg
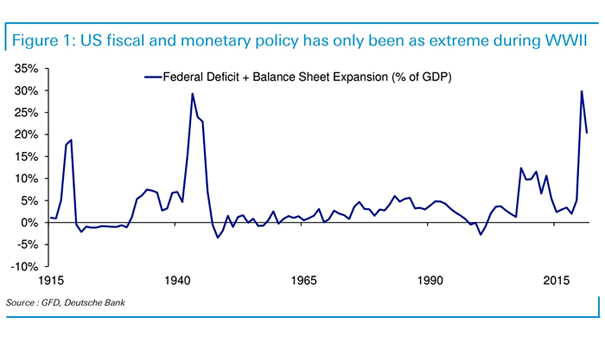
U.S. Federal Deficit and Balance Sheet Expansion Is the U.S. fiscal and monetary policy response to the COVID-19 crisis appropriate to ensure continued economic growth? Image: Deutsche Bank
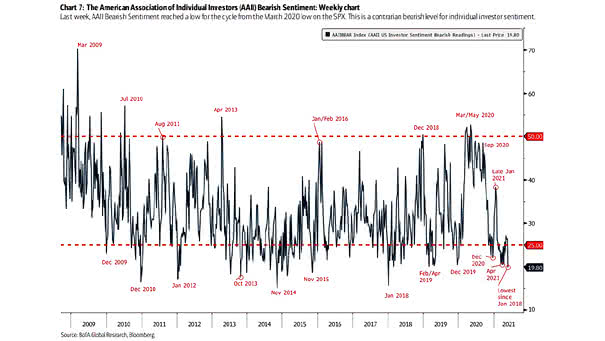
AAII Bearish Sentiment The AAII Bearish Sentiment reached a low at 19.8%, which is contrarian bearish. Image: BofA Global Research