Inflation – U.S. Core CPI Forecast
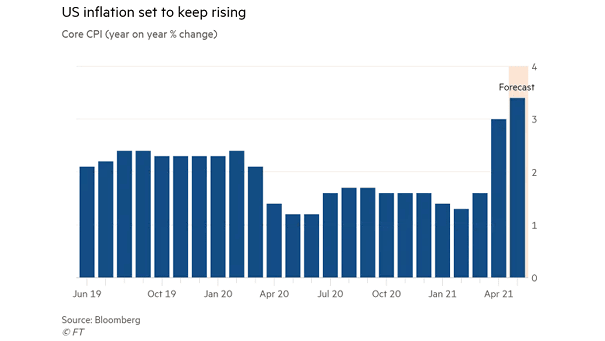
Inflation – U.S. Core CPI Forecast What impact will rising inflation have on the U.S. stock market? Image: Financial Times
Inflation – U.S. Core CPI Forecast What impact will rising inflation have on the U.S. stock market? Image: Financial Times
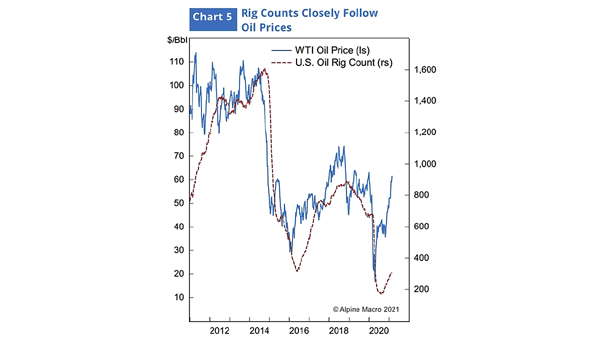
WTI Oil Price and U.S. Oil Rig Count Rising oil prices tend to lead to an increase in rig counts. Image: Alpine Macro
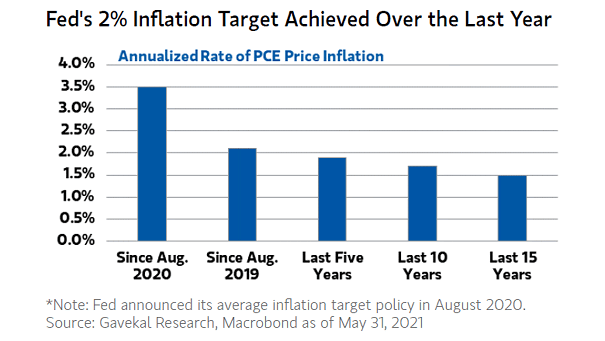
Annualized Rate of PCE Price Inflation Is the rise in inflation transitory or more structural? Image: Morgan Stanley Wealth Management
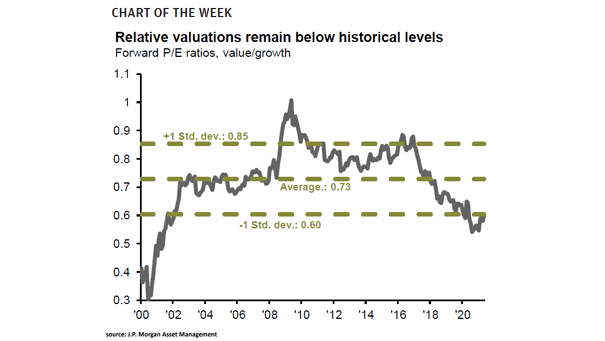
Value vs. Growth – Forward P/E Ratios Value stocks still look cheap relative to growth stocks, despite the recent strength in value stocks. Image: J.P. Morgan Asset Management
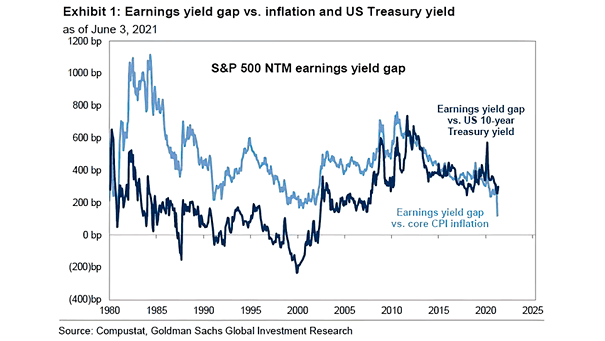
S&P 500 NTM Earnings Yield Gap – Earnings Yield Gap vs. Inflation and U.S. Treasury Yield The earnings yield gap vs. U.S. 10-year Treasury yield is low, but still above its long-term average. Image: Goldman Sachs Global Investment Research
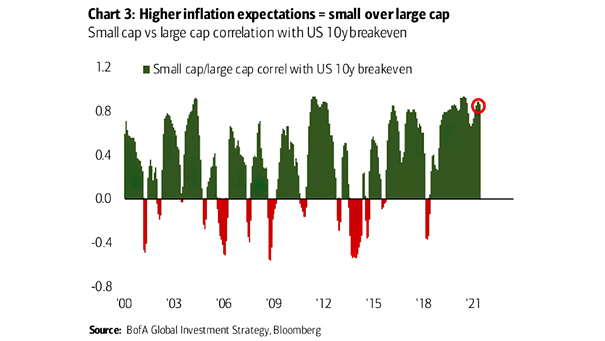
Small Cap vs. Large Cap Correlation with US 10-Year Breakeven When inflation expectations rise, small-caps tend to outperform large caps. Image: BofA Global Investment Strategy
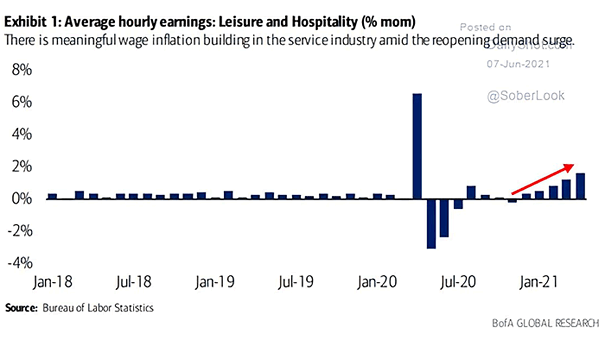
U.S. Wage Inflation – Average Hourly Earnings: Leisure and Hospitality Wage inflation is building in the service industry in a context of labor shortages. Image: BofA Global Research
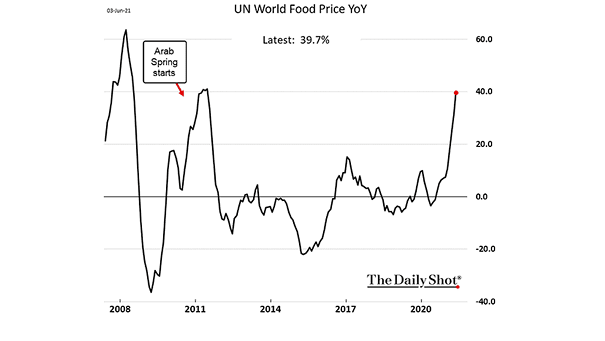
Inflation – UN World Food Price YoY World food prices are surging to their highest level in almost a decade and could portend social unrest. Image: The Daily Shot
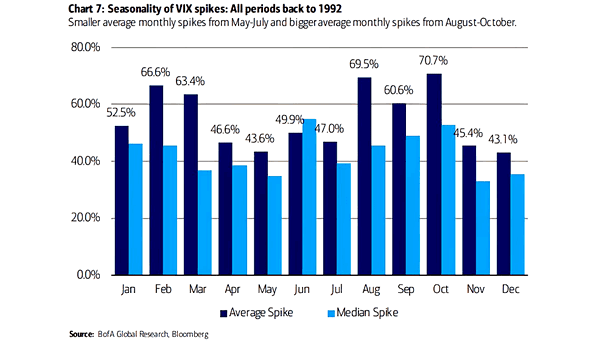
VIX – Volatility Index Seasonality of Spikes from Prior Month Low into Current Month Peak Historically, May-July tends to see decreased risk of VIX spikes. Image: BofA Global Research
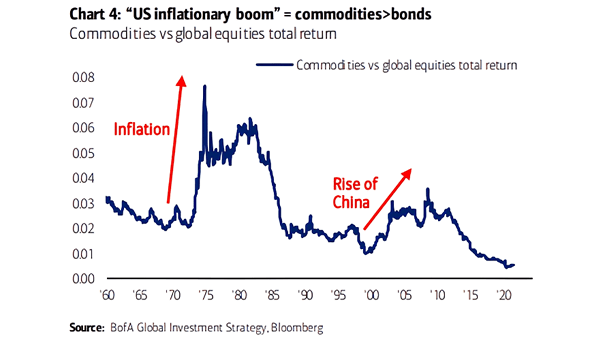
Commodities vs. Global Equities Total Return Commodities have long been considered a powerful hedge against inflation. Image: BofA Global Investment Strategy
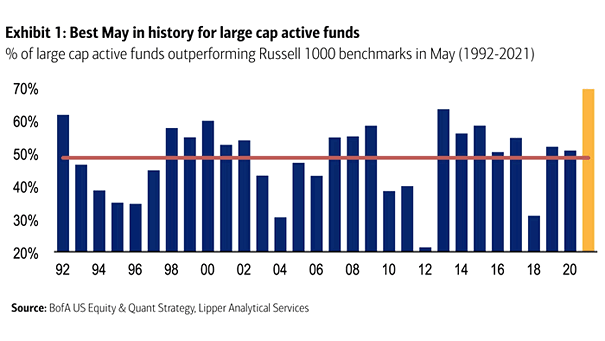
% of Large Cap Active Funds Outperforming Russell 1000 Benchmarks in May Best May in history for actively managed large-cap funds. But can active large-cap funds outperform benchmark over a full market cycle? Image: BofA US Equity & Quant Strategy