S&P 500 Real Total Return and Secular Trend
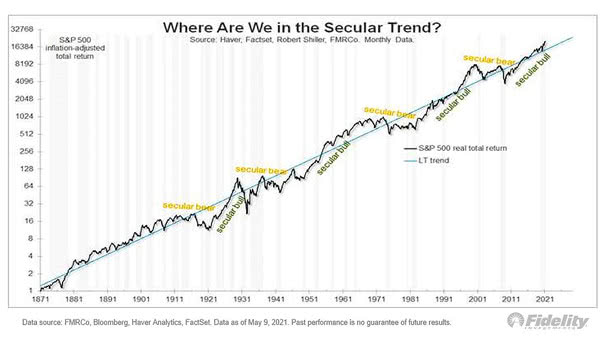
S&P 500 Real Total Return and Secular Trend Has the current secular bull market several more years left to run? Image: Fidelity Investments
S&P 500 Real Total Return and Secular Trend Has the current secular bull market several more years left to run? Image: Fidelity Investments
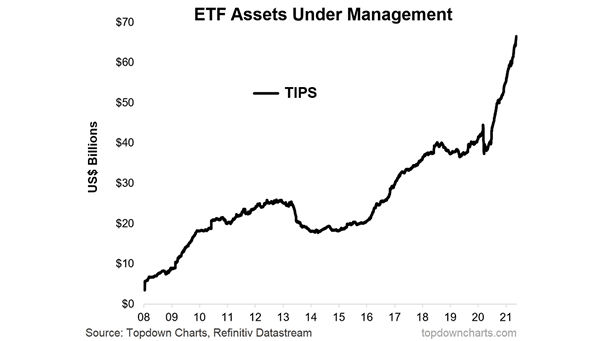
Treasury Inflation-Protected Securities (TIPS) – ETF Assets Under Management Assets under management in TIPS ETFs surge to record high, as the Federal Reserve lets the U.S. economy run hot. Image: Topdown Charts
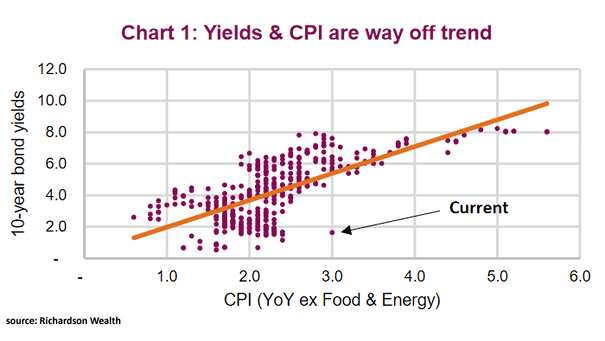
Inflation – U.S. 10-Year Bond Yields and CPI (YoY ex Food and Energy) Bond yields are low given current CPI, suggesting that the rise of inflation is temporary. Image: Richardson Wealth
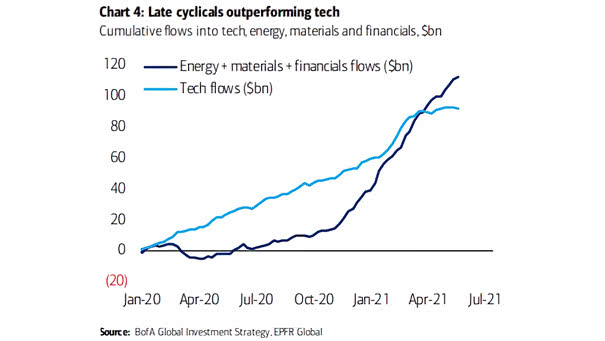
Cumulative Flows Into Tech, Energy, Materials and Financials Late cyclicals flows are outperforming tech year-to-date. Image: BofA Global Research
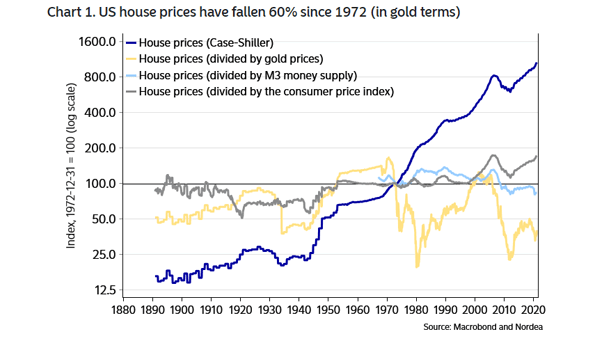
Housing – U.S. House Prices In nominal terms, U.S. house prices are soaring. But in gold terms, they have fallen by 60% since 1972. Image: Nordea and Macrobond
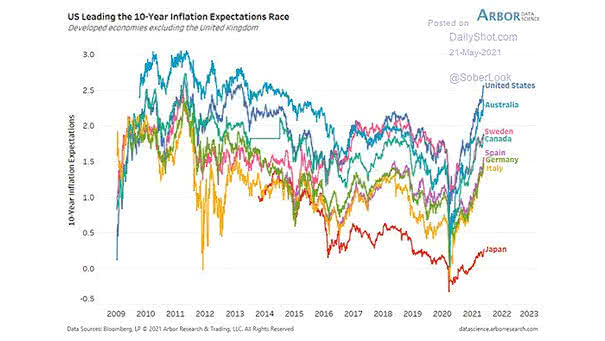
10-Year Inflation Expectations The Federal Reserve is not worried about inflation, so far. Image: Arbor Research & Trading LLC
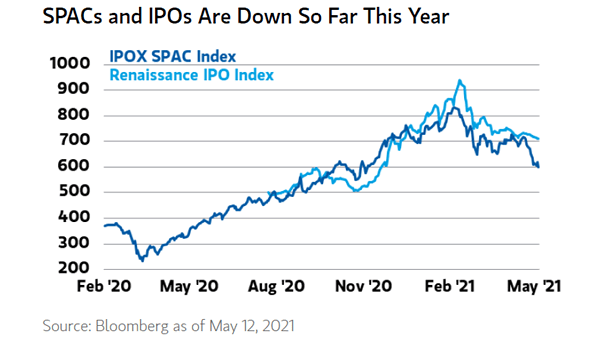
SPACs and IPOs SPACs and IPOs are down year-to-date, but are they out? Image: Morgan Stanley Wealth Management
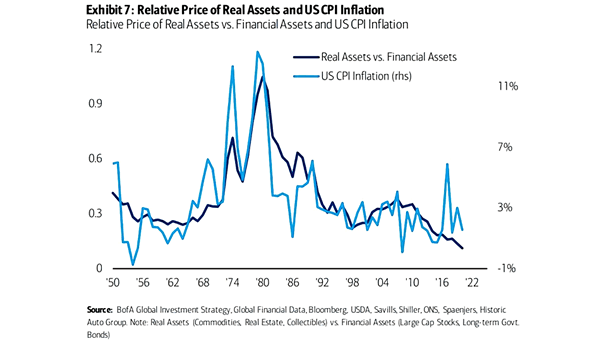
Relative Price of Real Assets vs. Financial Assets and U.S. CPI Inflation Real assets tend to move in line with inflation and generally performs well in inflationary environments. Image: BofA Global Investment Strategy
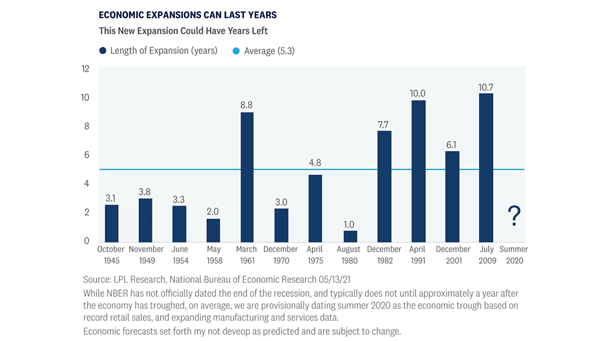
Economic Cycle – U.S. Economic Expansion Economic cycles of growth can last many years, with an average of more than five years. Image: LPL Research
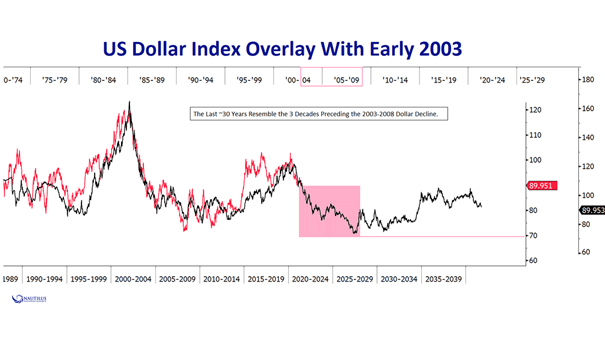
U.S. Dollar Index Overlay With Early 2003 Will the U.S. dollar depreciate further over the next few years? Image: Nautilus Research Click the Image to Enlarge
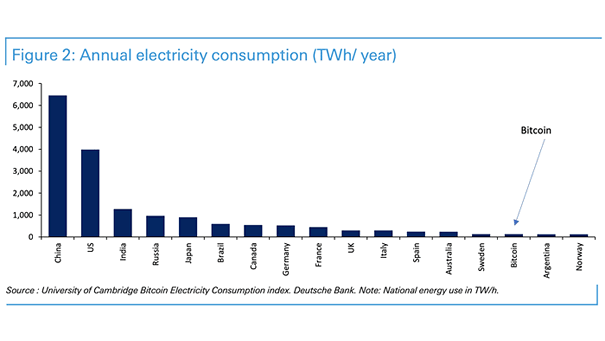
Bitcoin – Annual Electricity Consumption Bitcoin now consumes more electricity per year than Argentina. Image: Deutsche Bank