Core Inflation Forecasts vs. History
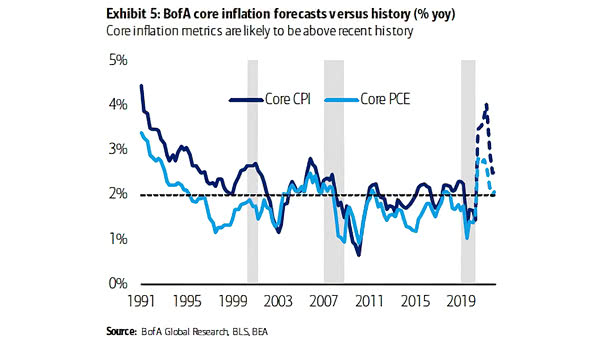
Core Inflation Forecasts vs. History The forecast suggests that U.S. core inflation will be consistently above the recent history. Image: BofA Global Research
Core Inflation Forecasts vs. History The forecast suggests that U.S. core inflation will be consistently above the recent history. Image: BofA Global Research
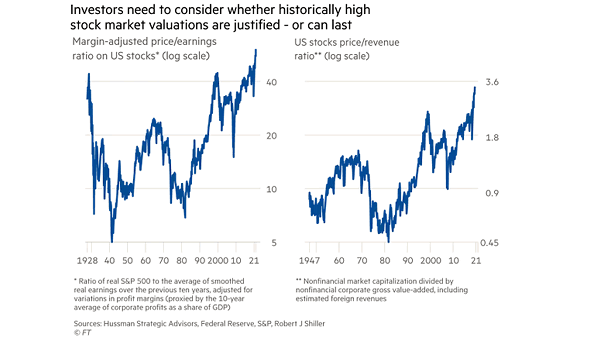
Valuation – Margin-Adjusted Price/Earnings Ratio on U.S. Stocks and U.S. Stocks Price/Revenue Ratio Will central bank liquidity continue to push valuations higher indefinitely? Image: Financial Times
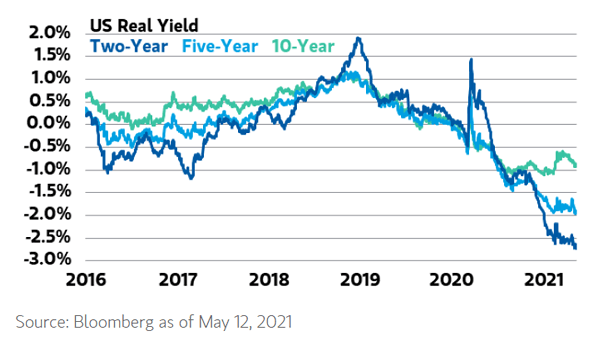
U.S. Real Yield U.S. real rates have dropped and are punishing those who save by causing them to save more. Image: Morgan Stanley Wealth Management
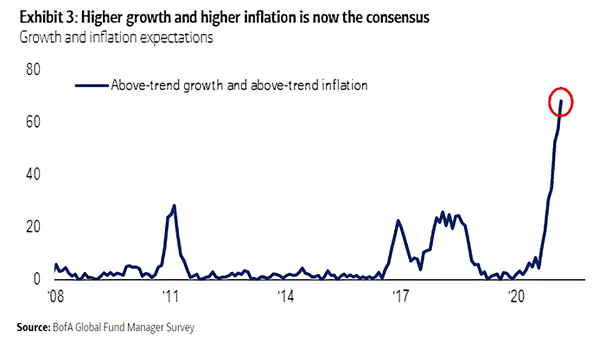
Growth and Inflation Expectations Should investors really expect higher growth and higher inflation? Image: BofA Global Fund Manager Survey
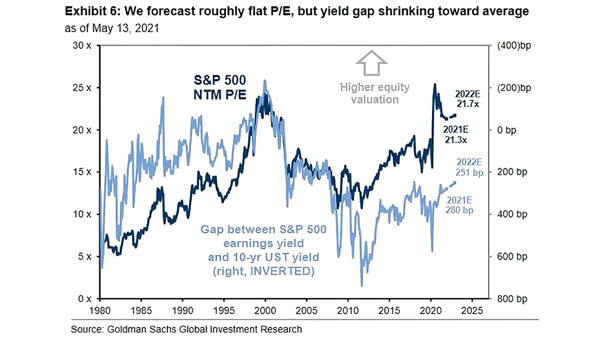
Valuation – S&P 500 NTM P/E vs. Gap Between S&P 500 Earnings Yield and U.S. 10-Year Treasury Yield Goldman Sachs expects a roughly flat S&P 500 P/E multiple through 2022. Image: Goldman Sachs Global Investment Research
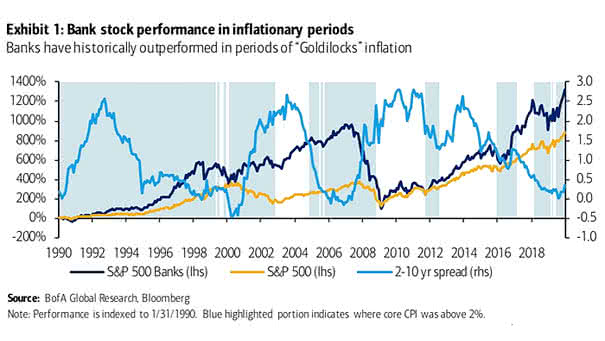
Performance – S&P 500 Banks vs. S&P 500 and 2-10 Year Spreads Historically, banks tend to outperform the S&P 500 in periods of modest inflation. Image: BofA Global Research
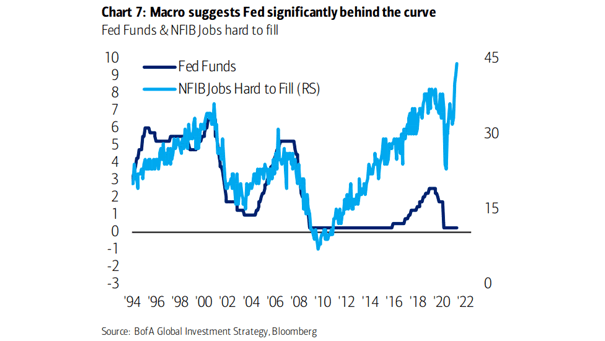
Fed Funds and NFIB Jobs Hard to Fill Is the Federal Reserve behind the curve? Image: BofA Global Investment Strategy
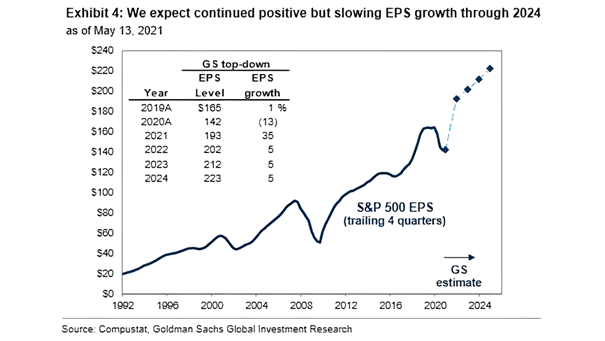
Top-Down S&P 500 EPS Estimates Goldman Sachs now expects EPS will rise by 35% this year and 5% in 2022. Image: Goldman Sachs Global Investment Research
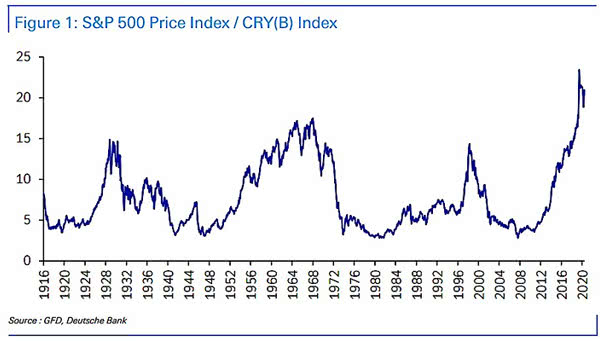
Commodities – S&P 500 Price Index/CRY(B) Index Are commodities a bargain relative to U.S. equities? Historically, commodities tend to underperform inflation over the long run and stocks tend to outperform. Image: Deutsche Bank
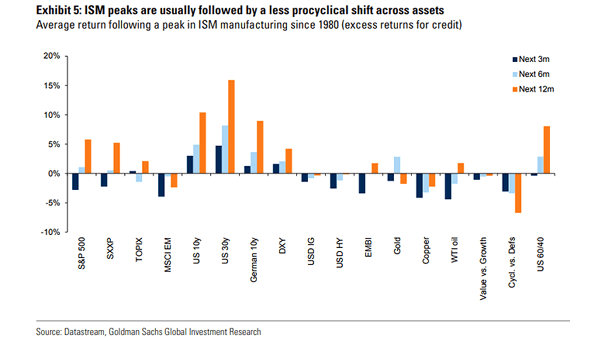
Average Return Following a Peak in ISM Manufacturing After a peak in ISM manufacturing, the forward return on the S&P 500 tends to be negative on average over the next 3 months. Image: Goldman Sachs Global Investment Research
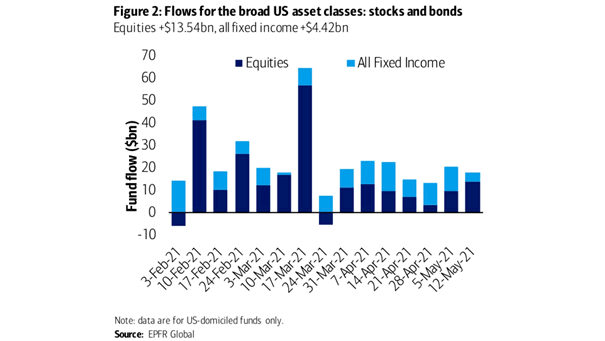
Flows for the Broad U.S. Asset Classes: Bonds and Stocks This week, inflows into bonds and stocks (U.S.-domiciled funds only). Image: BofA Global Research