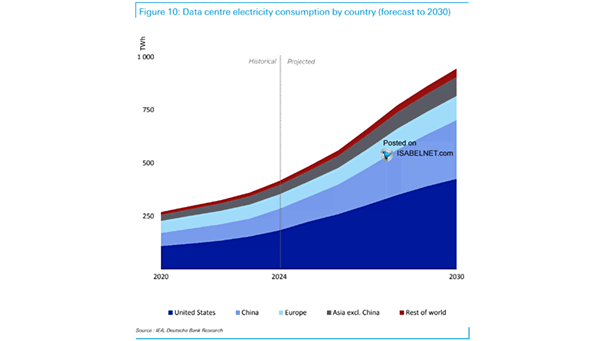
After-Tax Nonfinancial Corporate Profits as Share of Gross Value Added

After-Tax Nonfinancial Corporate Profits as Share of Gross Value Added While U.S. corporate profits fell in Q1 2025 due to higher costs and economic uncertainty, they remain historically high, reflecting both the strength and the vulnerability of large companies in the current economic climate. Image: Bloomberg

Weekly Net Flow to U.S. Bitcoin and Gold ETFs

Weekly Net Flow to U.S. Bitcoin and Gold ETFs Over the past five weeks, U.S.-listed Bitcoin ETFs have attracted more than $9 billion, while gold-backed ETFs have seen outflows of $2.8 billion. This trend highlights Bitcoin’s growing recognition as a credible hedge in investment portfolios. Image: Bloomberg

U.S. Real GDP Growth

U.S. Real GDP Growth Goldman Sachs projects U.S. GDP growth of 1.5% in 2025 and 1.6% in 2026, both slightly above the consensus estimates of major forecasters. Image: Goldman Sachs Global Investment Research

S&P 500 Performance One Year After 5% Monthly Gains

S&P 500 Performance One Year After 5% Monthly Gains There’s very good news for bulls: Since 1950, whenever the S&P 500 has gained more than 5% in May, it has historically been higher 12 months later, with an average increase of 19.9%. Image: Carson Investment Research

Valuation – U.S. Equities vs. Rest of World – 12-Month Forward PE Ratios

Valuation – U.S. Equities vs. Rest of World – 12-Month Forward PE Ratios U.S. equities trade at historically high valuations versus global peers, with the premium widening. While strong fundamentals support this, it also poses risks if growth expectations decline or macroeconomic conditions worsen. Image: Deutsche Bank

S&P 500 Drawdown in DXY Dollar Index

S&P 500 Drawdown in DXY Dollar Index The U.S. equity drawdown has caused major losses for non-U.S. investors, as falling stock prices and a weaker dollar combined. This has prompted many to reconsider their currency risk strategies and exposure to U.S. equities. Image: Gavekal, Macrobond

U.S. Current Activity Indicator

U.S. Current Activity Indicator U.S. soft data and growth signals have improved slightly, largely due to a more favorable trade policy outlook following the partial rollback of tariffs. Image: Goldman Sachs Global Investment Research

S&P 500 Performance After at Least 15 Weeks of AAII Bears over Bulls Ends

S&P 500 Performance After at Least 15 Weeks of AAII Bears over Bulls Ends A streak of 15 consecutive weeks with more bears than bulls in the AAII survey is rare—only four other periods have lasted this long. In each case, the S&P 500 was higher 12 months later, with an average gain of 27.5%.…

Impact of Higher Tariffs on the U.S. Core PCE Price Index

Impact of Higher Tariffs on the U.S. Core PCE Price Index The coming inflation rebound is expected be limited in scope and duration, meaning it is unlikely to trigger the kind of persistent inflation psychology that can drive a sustained wage-price spiral. Image: Goldman Sachs Global Investment Research

Money Market Fund Assets

Money Market Fund Assets While the $7 trillion in money market funds is frequently cited as potential fuel for equities and risk assets, most evidence suggests this cash is primarily a result of yield optimization and prudent cash management. Image: Bloomberg

U.S. Recession Odds

U.S. Recession Odds A Bloomberg survey in May 2025 puts the likelihood of a U.S. downturn in the next year at 40%—a drop from 45% in April, but still considerably higher than the 30% forecast in March. Image: Bloomberg