Performance – S&P Banks / S&P 500 and U.S. 10-Year Treasury Yield
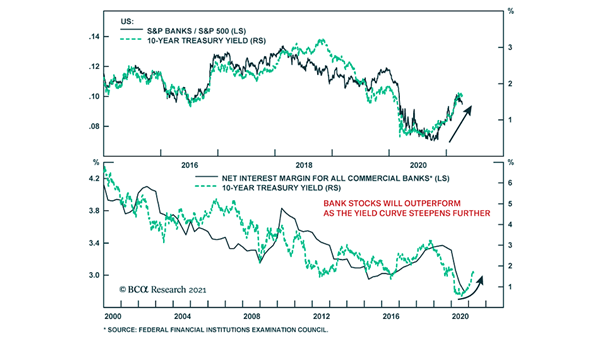
Performance – S&P Banks / S&P 500 and U.S. 10-Year Treasury Yield Bank stocks could benefit from the steepening yield curve and outperform the S&P 500. Image: BCA Research
Performance – S&P Banks / S&P 500 and U.S. 10-Year Treasury Yield Bank stocks could benefit from the steepening yield curve and outperform the S&P 500. Image: BCA Research
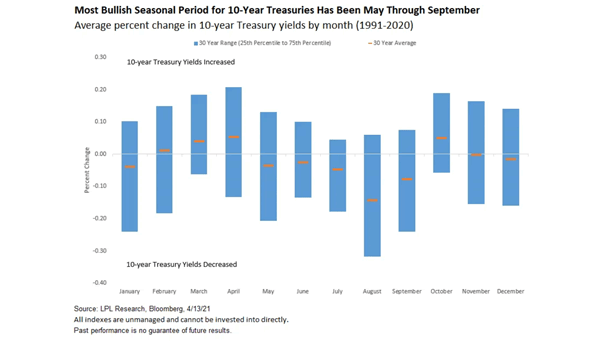
Seasonality – Average Percent Change in U.S. 10-Year Treasury Yields by Month Historically, the months of May through September tend to be bullish for 10-year Treasuries. Image: LPL Research
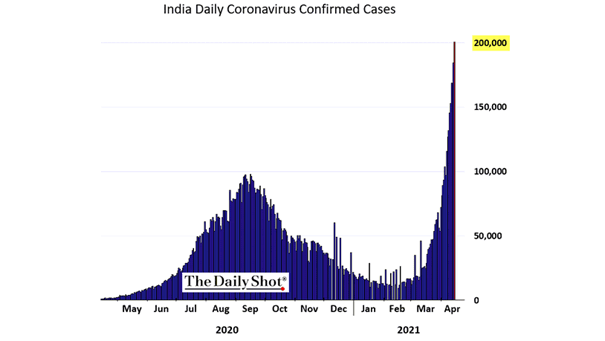
India Daily Coronavirus Confirmed Cases The second wave of COVID-19 in India shows no signs of slowing, as new daily cases of coronavirus exceed 200,000. Image: The Daily Shot
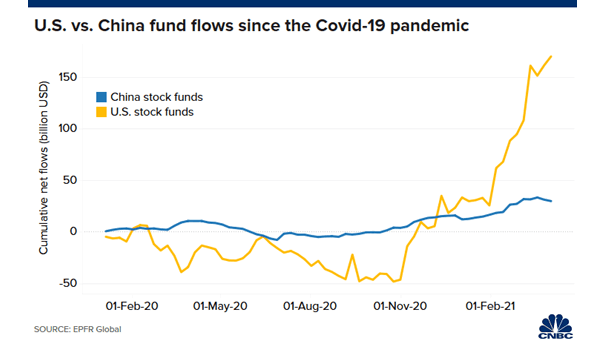
United States vs. China Stock Funds Flows This year, inflows into U.S. stock funds exceed inflows into China stock funds. Does the scale of the stimulus in the U.S. act like gravity? Image: CNBC
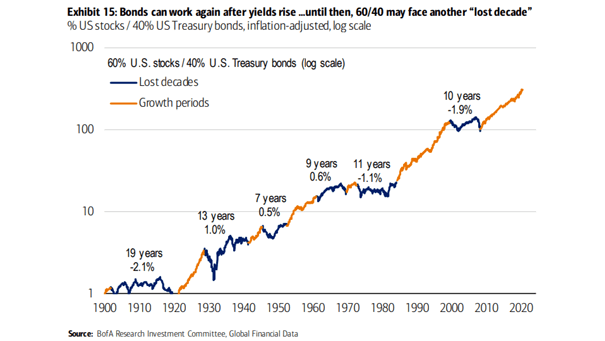
Returns – 60% U.S. Stocks / 40% U.S. Treasury Bonds – Lost Decades and Growth Periods Will a 60/40 portfolio face another lost decade? Image: BofA Research Investment Committee
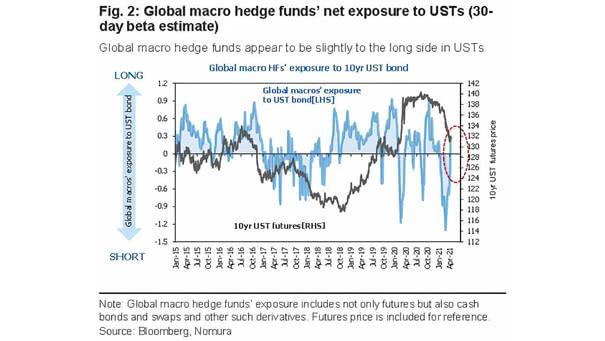
Global Macro Hedge Funds’ Net Exposure to U.S. 10-Year Treasury Bond In terms of positioning, global macro hedge funds are currently long U.S. Treasuries. Image: Nomura
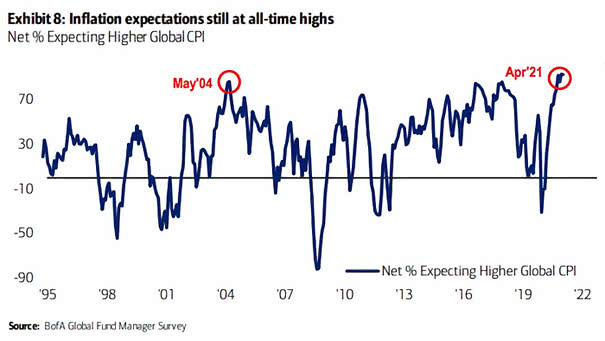
FMS Investors and Inflation Expectations Is inflation coming, as inflation expectations remain at an all time high? Image: BofA Global Fund Manager Survey

Change in Expected GDP Only the United States has a higher expected GDP than pre-pandemic. Image: BofA Global Research
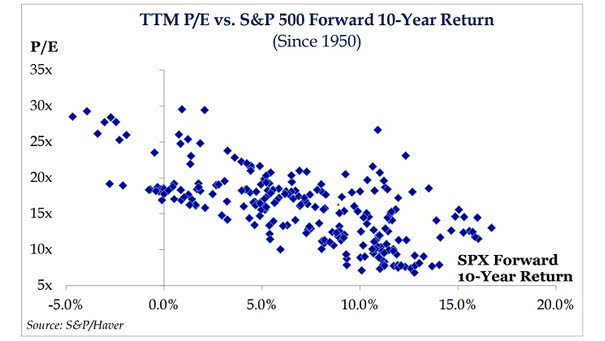
Valuation – TTM P/E vs. S&P 500 Forward 10-Year Return Should investors expect anemic returns over the next 10 years? Image: Strategas Research Partners
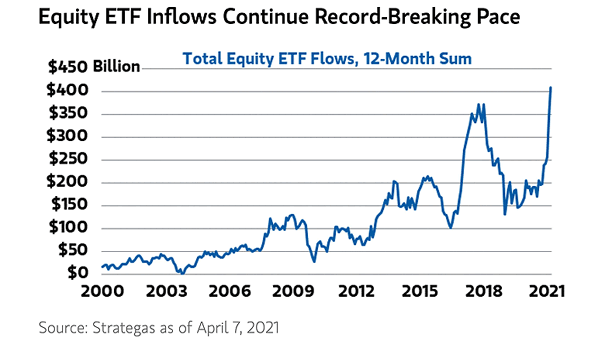
Total Equity ETF Flows Equity ETF inflows remain strong. Image: Morgan Stanley Wealth Management
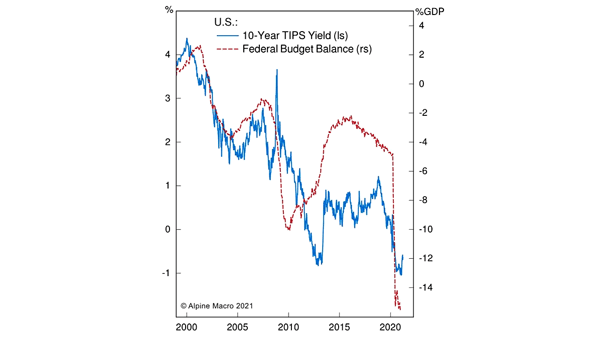
U.S. 10-Year TIPS Yield and Federal Budget Balance A larger U.S. budget deficit tends to lead to a lower TIPS yield. Image: Alpine Macro