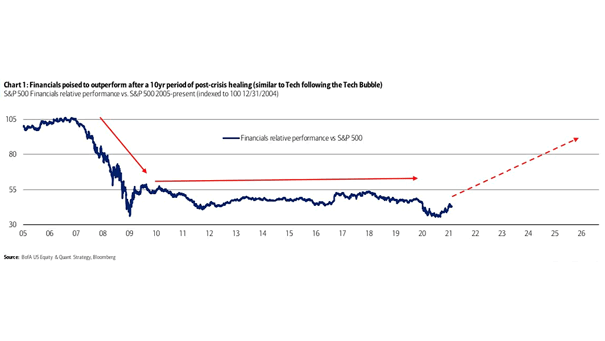
S&P 500 Financials Relative Performance vs. S&P 500
S&P 500 Financials Relative Performance vs. S&P 500 Will financials outperform the S&P 500 over the next few years? Image: BofA US Equity & Quant Strategy
S&P 500 Financials Relative Performance vs. S&P 500 Will financials outperform the S&P 500 over the next few years? Image: BofA US Equity & Quant Strategy
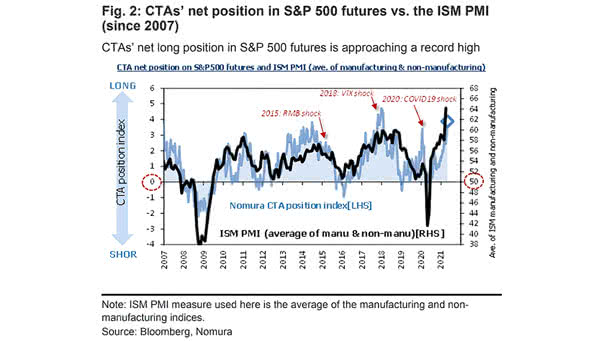
CTAs’ Net Position in S&P 500 Futures vs. the ISM PMI CTAs remain net buyers of S&P 500 futures. Image: Nomura
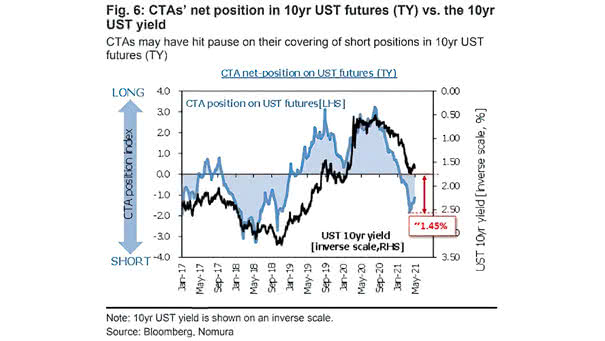
CTAs’ Net Positions in 10-Year U.S. Treasury Futures vs. the 10-Year U.S. Treasury Yield CTAs appear to have paused in covering their short positions in 10-year U.S. Treasury futures. Image: Nomura
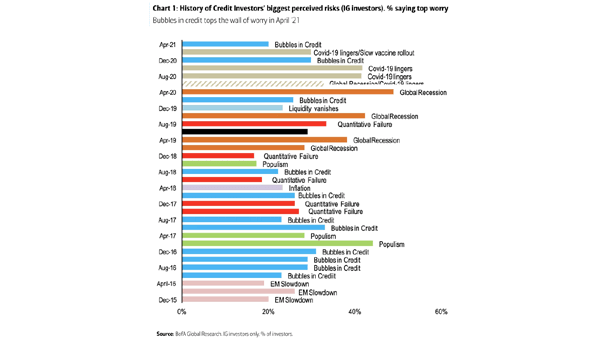
Bubbles – History of Credit Investors’ Biggest Perceived Risks Is there a credit bubble in the making? Image: BofA Global Research
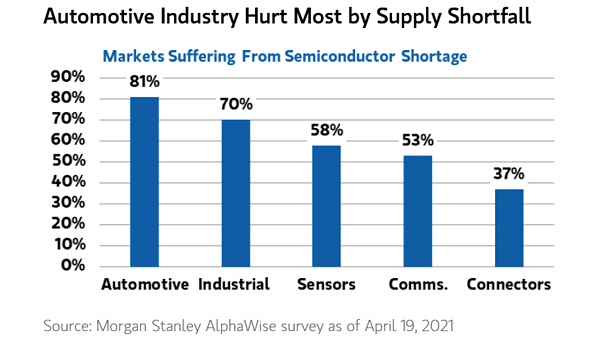
Markets Suffering From Semiconductor Shortage How long will the semiconductor shortage last? Image: Morgan Stanley Wealth Management
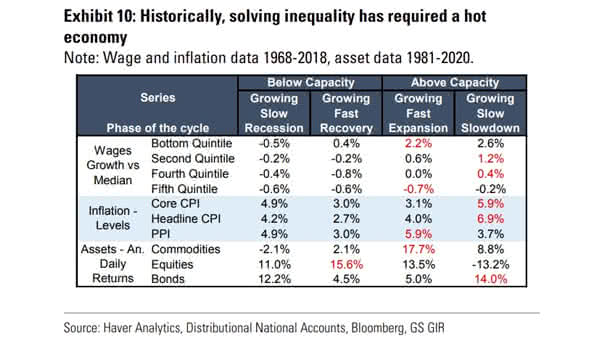
Solving Inequality – Wages Growth, Inflation, Assets Returns A hot economy tends to reduce inequality. Image: Goldman Sachs Global Investment Research
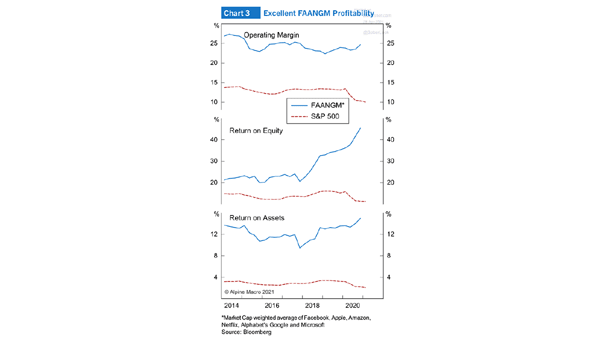
FAANGM Stocks vs. S&P 500 – Operating Margin, Return on Equity and Return on Assets Will FAANGM stocks continue to drive the S&P 500 higher? Image: Alpine Macro
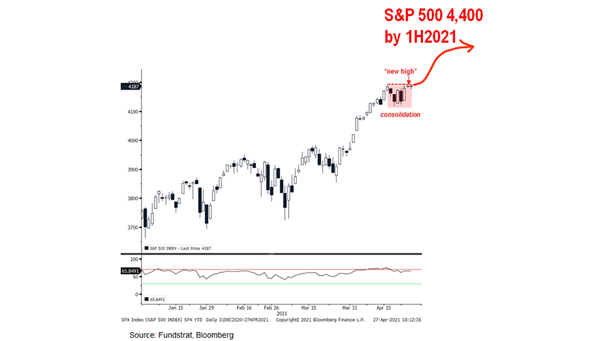
S&P 500 Breakout The breakout could be a signal for a move towards 4,400 for the S&P 500 by 1H2021. Image: Fundstrat Global Advisors, LLC
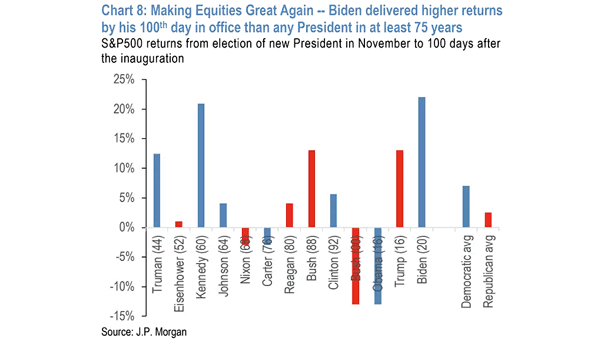
S&P 500 Returns from Election of New President in November to 100 Days After the Inauguration President Joe Biden’s 100-day stock market performance is the strongest in at least 75 years. Image: J.P. Morgan
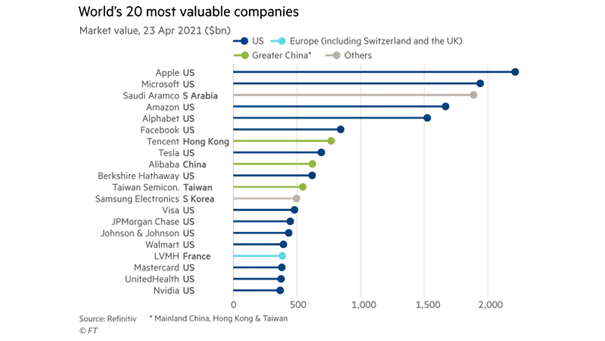
World’s 20 Most Valuable Companies – Market Value Apple remains the most valuable company in the world. Image: Financial Times
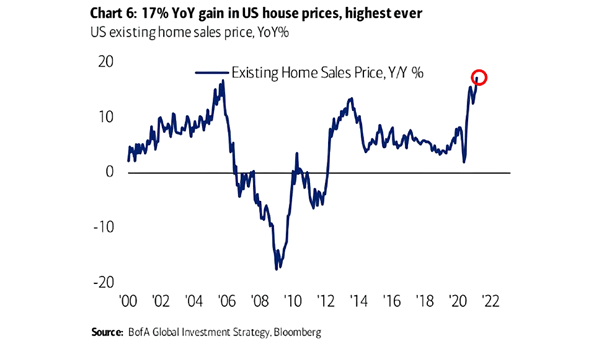
U.S. Housing – Existing Home Sales Price U.S. house prices rise much faster than wages and become too expensive for most young people. Image: BofA Global Investment Strategy