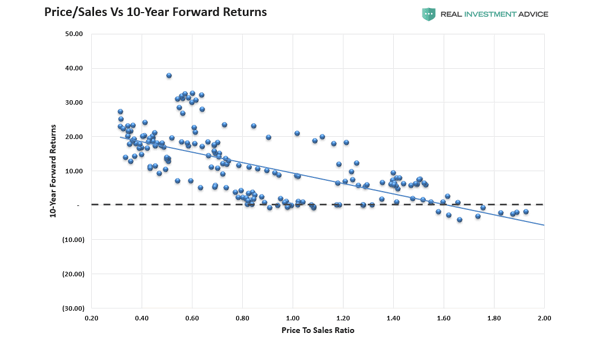
Price to Sales Ratio vs. 10-Year Forward Returns
Price to Sales Ratio vs. 10-Year Forward Returns Should investors expect anemic returns over the next 10 years with a price-to-sales ratio above 2? Image: Real Investment Advice
Price to Sales Ratio vs. 10-Year Forward Returns Should investors expect anemic returns over the next 10 years with a price-to-sales ratio above 2? Image: Real Investment Advice
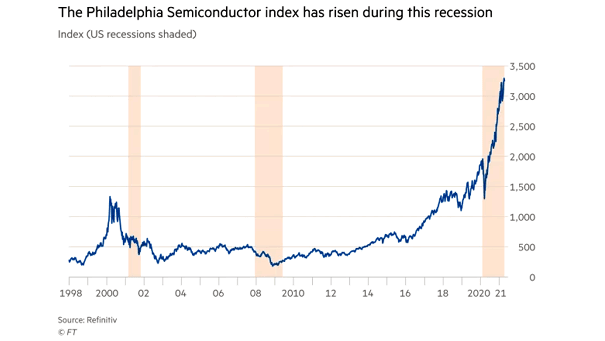
Stocks – Philadelphia Semiconductor Index (SOX) Can semiconductor stocks continue to soar this year? Image: Financial Times
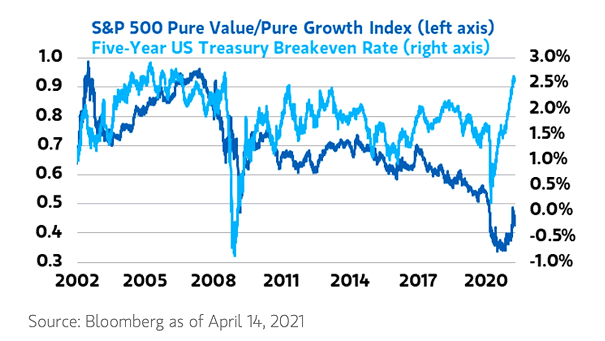
S&P 500 Pure Value/Pure Growth Index and 5-Year U.S. Treasury Breakeven Rate The 5-year U.S. Treasury breakeven rate tends to drive the rotation from growth stocks to value stocks. Image: Morgan Stanley Wealth Management
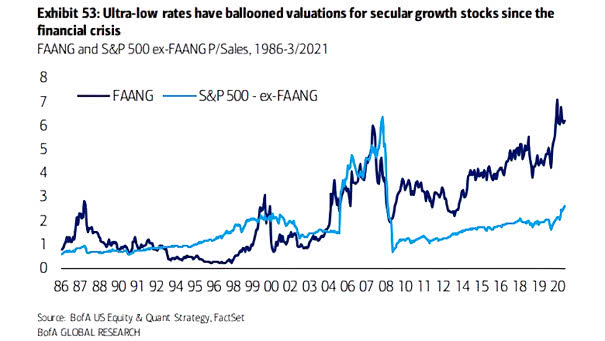
Valuation – FAANG and S&P 500 Ex-FAANG Price-To-Sales Ratios Ultra-low rates tend to push price-to-sales ratios higher. Image: BofA US Equity & Quant Strategy
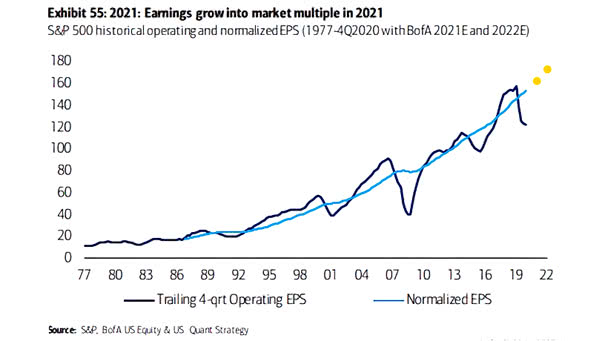
Earnings Growth – S&P 500 Historical Operating and Normalized EPS The U.S. stock market needs earnings growth to rise in 2021 and 2022 as the global economy recovers. Image: BofA US Equity & Quant Strategy
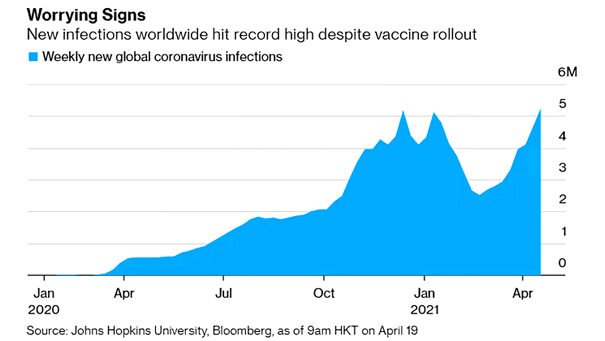
Weekly New Global Coronavirus Infections Is the coronavirus pandemic far from over despite vaccinations? Image: Bloomberg
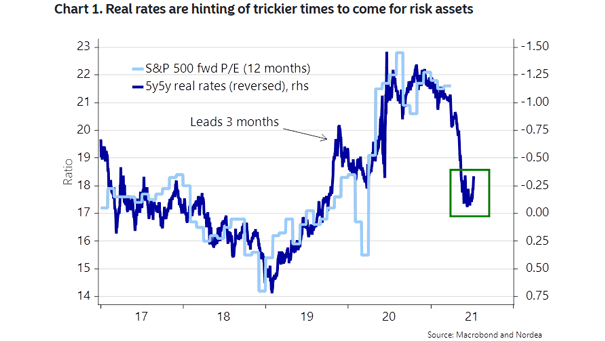
Real Rates vs. S&P 500 Forward P/E Ratio Should investors expect a weak summer for U.S. equities? Image: Nordea and Macrobond
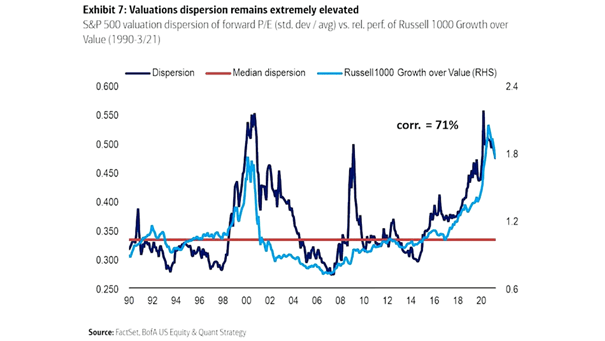
S&P 500 Valuation Dispersion of Forward P/E vs. Relative Performance of Russell 1000 Growth over Value Valuations dispersion remains at high levels and is 42% above its long-term median. Image: BofA US Equity & Quant Strategy
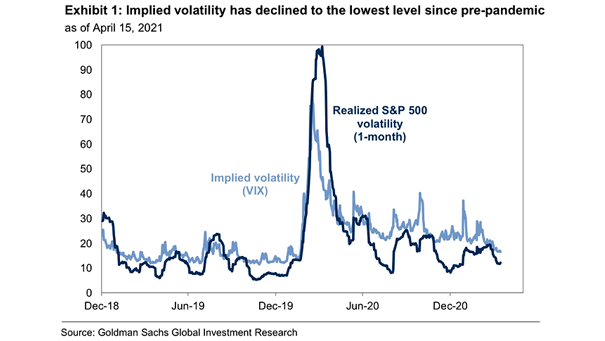
Implied Volatility (VIX) and Realized S&P 500 Volatility (1-Month) According to Goldman Sachs, the volatility risk premium will return toward 2021’s highs in the coming weeks. Image: Goldman Sachs Global Investment Research
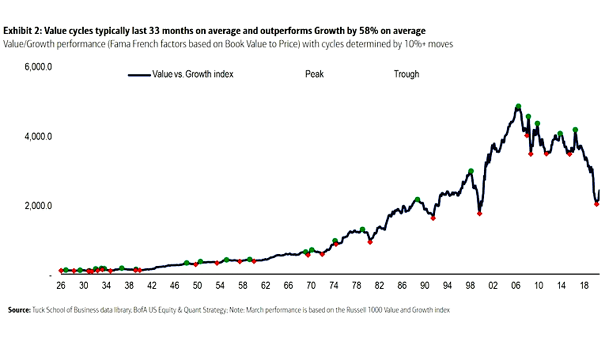
Value/Growth Performance Historically, Value tends to outperform Growth for 33 months on average. Image: BofA US Equity & Quant Strategy
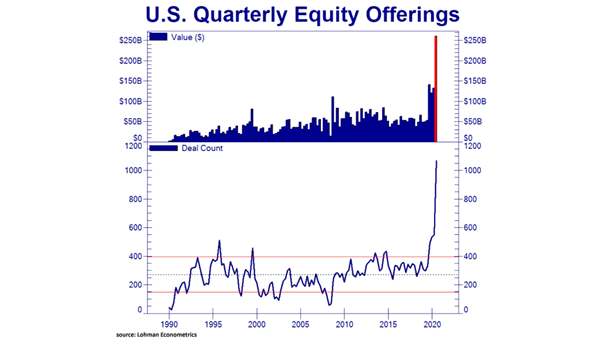
U.S. Quarterly Equity Offerings Equity offerings have increased dramatically in the first quarter this year. Image: Lohman Econometrics