Growth vs. Value Return
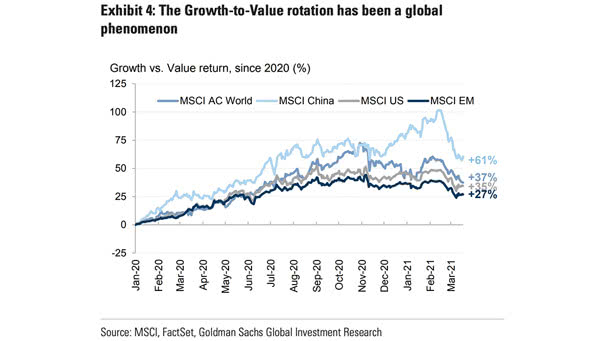
Growth vs. Value Return Value is beating Growth year-to-date. But is Value the long-term winner? Image: Goldman Sachs Global Investment Research
Growth vs. Value Return Value is beating Growth year-to-date. But is Value the long-term winner? Image: Goldman Sachs Global Investment Research
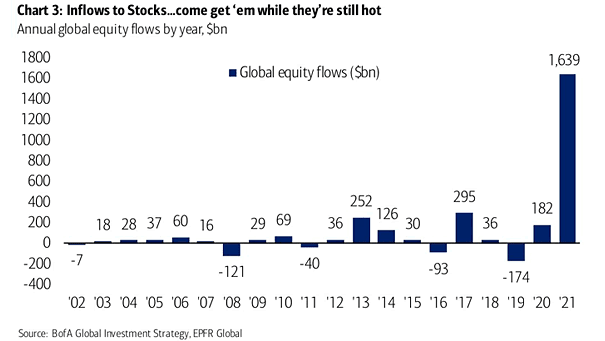
Annual Global Equity Flows Global equity inflows are very strong. Image: BofA Global Investment Strategy
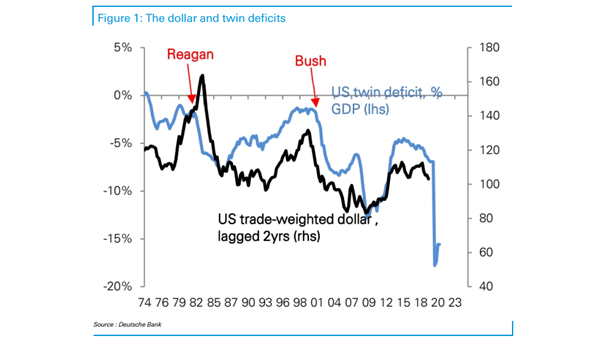
U.S. Trade-Weighted Dollar and Twin Deficits as % of GDP (Leading Indicator) Historically, the twin deficits tend to lead the U.S. dollar by two years. Image: Deutsche Bank
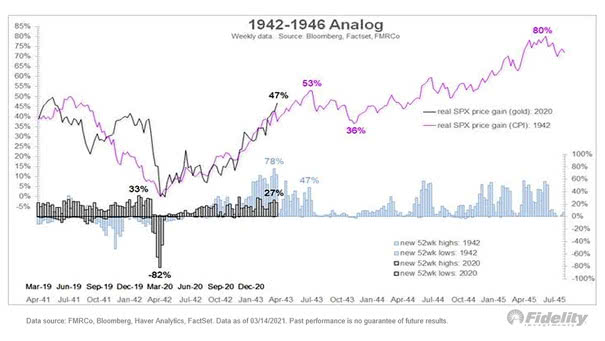
Real S&P 500 Gain and 1942-1946 Analog Will U.S. equities continue to follow the 1942-1946 analog? Image: Fidelity Investments

Distribution of Bitcoin Value by Fraction of Addresses (Accounts) Is everyone getting rich with Bitcoin? The top 2.4% of addresses with the largest balances own 95% of total Bitcoin. Image: BofA Global Research
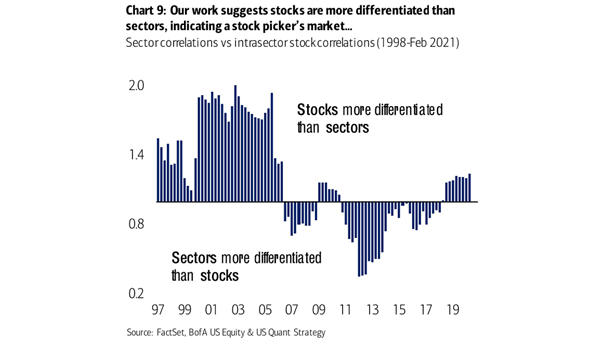
Stocks – Sector Correlations vs. Intrasector Stock Correlations The fact that stocks are more differentiated than sectors bodes well for stock pickers. Image: BofA US Equity & Quant Strategy
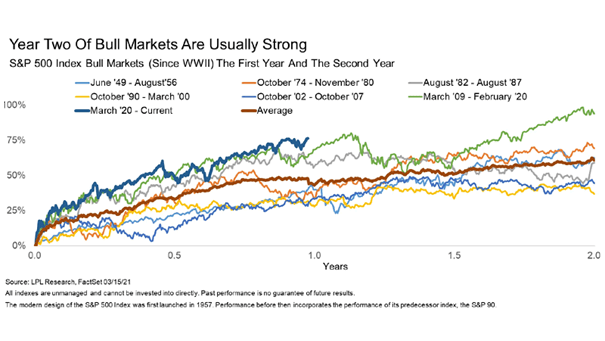
S&P 500 Index Bull Markets (Since WWII) The First Year and the Second Year Historically, the S&P 500 Index tends to add gains in year two of bull markets. Image: LPL Research
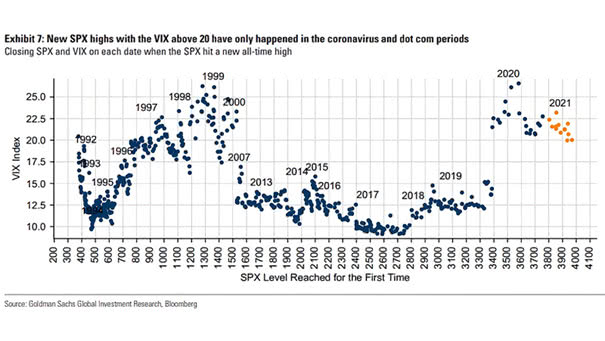
Closing S&P 500 and VIX on Each Data When S&P 500 Hit a New All-Time High New all-time highs for the S&P 500 with the VIX above 20 have only happened in the coronavirus and dot-com periods. Image: Goldman Sachs Global Investment Research
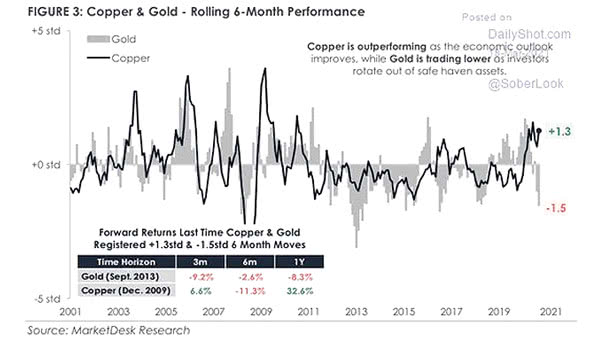
Copper and Gold – Rolling 6-Month Performance Copper prices are rising on a strong demand outlook and gold’s underperformance is a rotation into risky assets. Image: MarketDesk Research

Commodities – Relative to S&P 500: GSCI Commodity Index and CRB Continuous Commodity Index Are commodities a good bargain relative to U.S. equities? Image: BCA Research
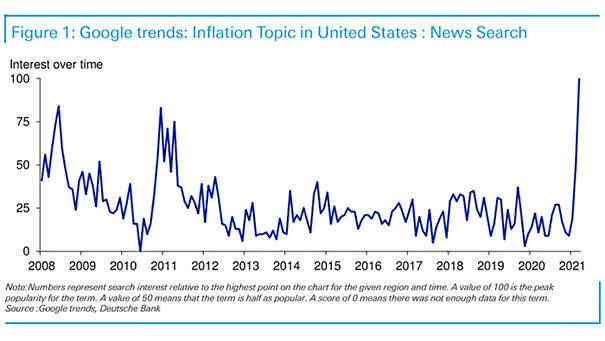
Google Trends – Inflation Topic in United States – News Search Searches for inflation in the United States are surging this year. Will inflation materialize? Image: Deutsche Bank