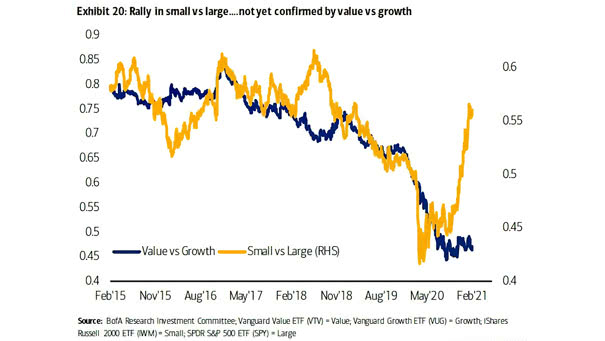
Value vs. Growth and Small Caps vs. Large Caps
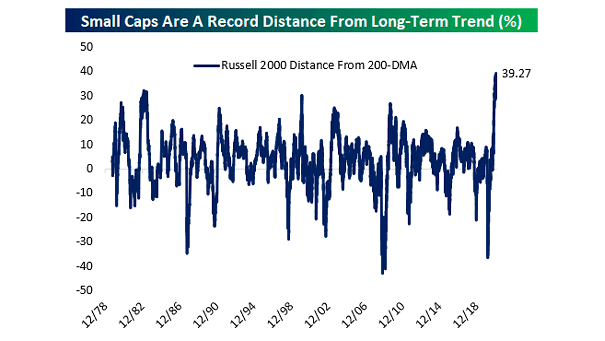
Value vs. Growth and Small Caps vs. Large Caps The rally in small caps is a strong bullish signal, but it has not yet been confirmed by a rebound in value vs. growth. Image: BofA Research Investment Committee