U.S. Stock Market’s Daily Volume
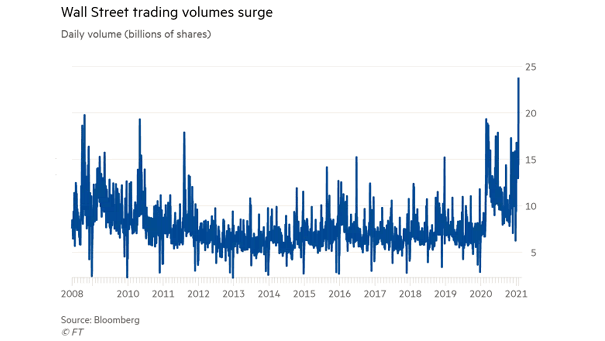
U.S. Stock Market’s Daily Volume U.S. stock trading volumes surge, as retail investors face down hedge funds. Image: Financial Times
U.S. Stock Market’s Daily Volume U.S. stock trading volumes surge, as retail investors face down hedge funds. Image: Financial Times
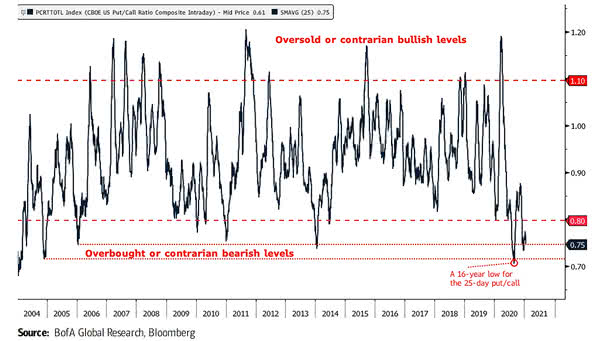
Sentiment – 25-Day U.S. Put/Call Ratio Bearish seasonality risk is increasing, as the 25-day put/call ratio is trading at relatively low levels. Image: BofA
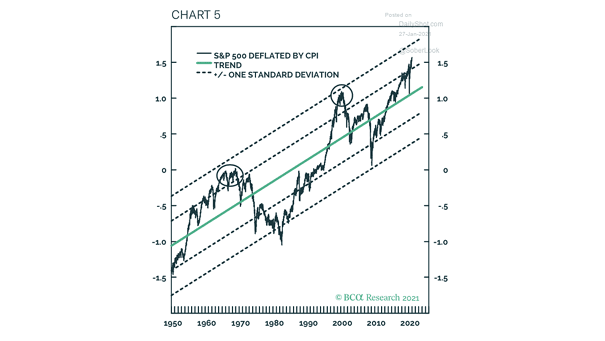
S&P 500 Deflated by CPI and Trend Is the S&P 500 in a bubble disconnected from reality? Image: BCA Research
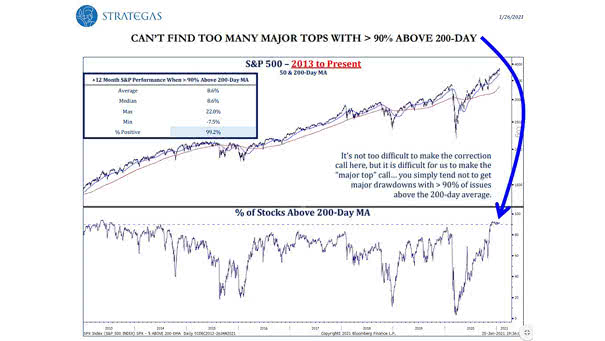
S&P 500 and % of Stocks Above 200-Day Moving Average When more than 90% of stocks are above their 200-day moving average, the S&P 500 tends to be positive over a 12-month period. Image: Strategas Research Partners
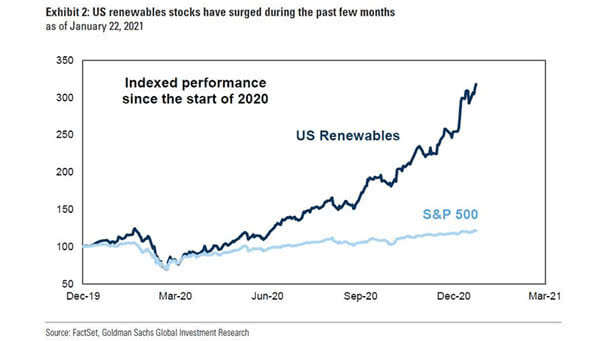
Performance – U.S. Renewables Stocks and S&P 500 U.S. renewables stocks have outperformed the S&P 500 by a large margin during the past 12 months. Image: Goldman Sachs Global Investment Research
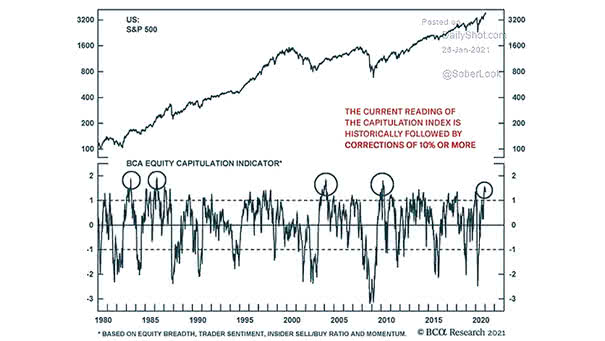
S&P 500 and Equity Capitulation Indicator Should investors expect a stock market correction of 10% or more? Image: BCA Research
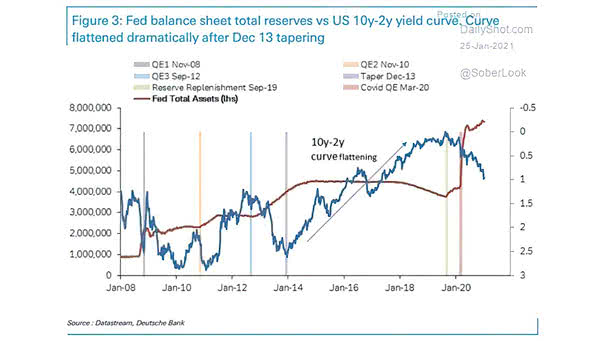
U.S. 10Y-2Y Yield Curve and Fed Balance Sheet Total Reserves What is the risk of tapering? After Dec-13 tapering, the U.S. Treasury yield curve flattened considerably. Image: Deutsche Bank
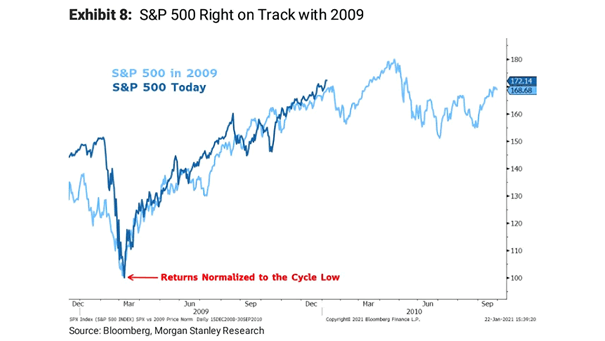
S&P 500 Today and S&P 500 in 2009 Is a correction coming? The S&P 500 is tracking the 2009 recovery analog, so far. Image: Morgan Stanley Research
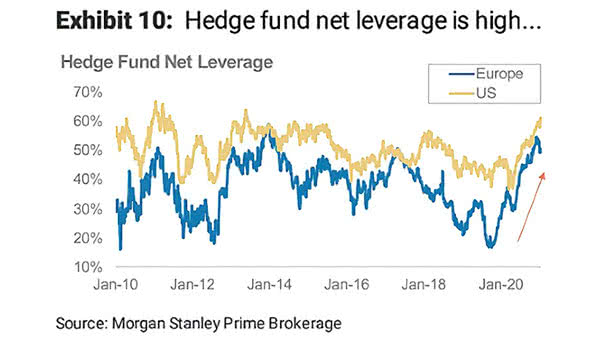
Hedge Fund Leverage Hedge fund net leverage is close to record levels. It is also high compared to the average level of the last ten years. Image: Morgan Stanley
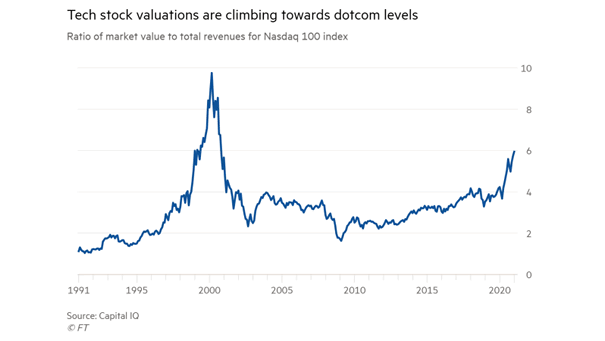
Valuation – Ratio of Market Value to Total Revenues for Nasdaq 100 Index How high can the Nasdaq 100 go? Image: Financial Times
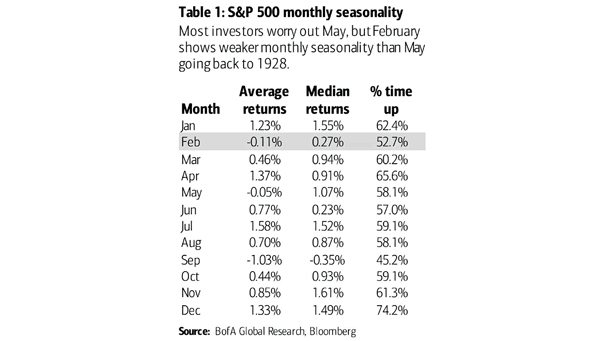
S&P 500 Monthly Seasonality Historically, February isn’t usually a great month. Image: BofA Global Research