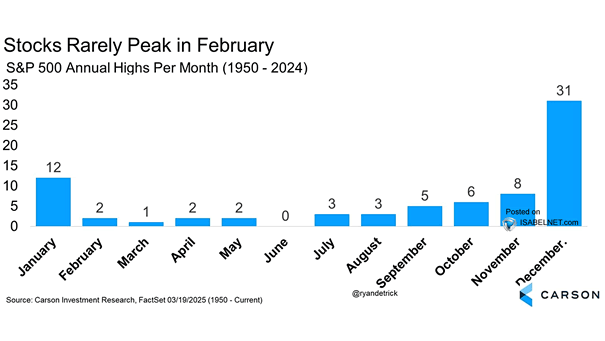
S&P 500 Annual Highs Per Month
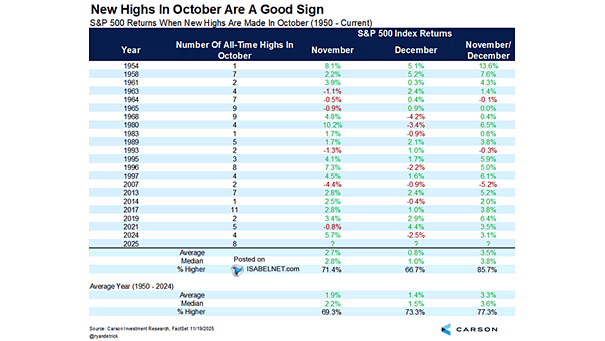
S&P 500 Annual Highs Per Month It’s still a bull market to love, even as the bears grow louder. History rarely sees the S&P 500 peak in October, and with new highs within reach, U.S. stocks may still have more room to run. Image: Carson Investment Research