Share of S&P 500 Company Quarter-Ahead EPS Guidance Above Consensus Estimates

Share of S&P 500 Company Quarter-Ahead EPS Guidance Above Consensus Estimates Strong earnings and confident forecasts are keeping corporate America bullish on near-term profits, adding fuel to already rich valuations. As long as companies deliver, investors are willing to look past rich pricing. Image: Goldman Sachs Global Investment Research
S&P 500 Performance During the 1980-2000 and 2013-Current Secular Bull Markets

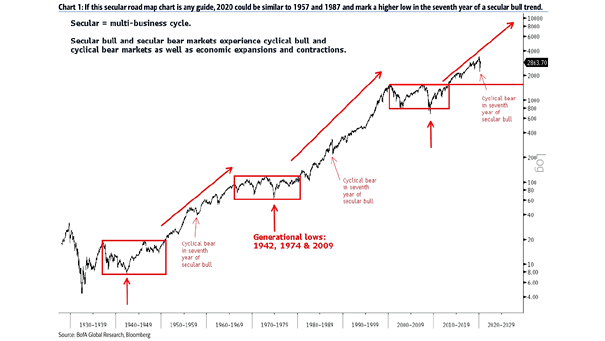
S&P 500 Performance During the 1980-2000 and 2013-Current Secular Bull Markets The S&P 500 has been rising since March 2013, but age alone doesn’t call the top. The last secular bull market ran nearly two decades. If history is any guide, this one may still have further to go. Image: Carson Investment Research

Number of S&P 500 Stocks Making New 52-Week Lows Above 20

Number of S&P 500 Stocks Making New 52-Week Lows Above 20 The number of S&P 500 stocks hitting new 52-week lows is rising, rarely a healthy signal. In sustained bull markets, new lows tend to stay below 20. That is not the kind of breadth you want to see in a healthy uptrend. Image: Bloomberg

S&P 500 – Bull Markets That Made It To 100%

S&P 500 – Bull Markets That Made It To 100% At just 3.5 years old and already up more than 100%, the current bull market still looks like it has legs, leaving bears stuck watching from the sidelines. Image: Goldman Sachs Global Investment Research
Retail Gasoline Price Change Between February 23 and April 27, 2026

Retail Gasoline Price Change Between February 23 and April 27, 2026 The Middle East conflict is sending fuel costs soaring across Asia, with gasoline prices in Southeast Asia up 37% since the war began. In the U.S., prices have surged 42%, a sharp rise that is hard to ignore. Image: J.P. Morgan Commodities Research

S&P 500 1-Month Forward Returns Based On Sentiment Indicator Level

S&P 500 1-Month Forward Returns Based On Sentiment Indicator Level Goldman Sachs’ U.S. Equity Sentiment Indicator sits at 1.7, a reading historically linked to an average 0.4% decline in the S&P 500 over the next month. Image: Goldman Sachs Global Investment Research
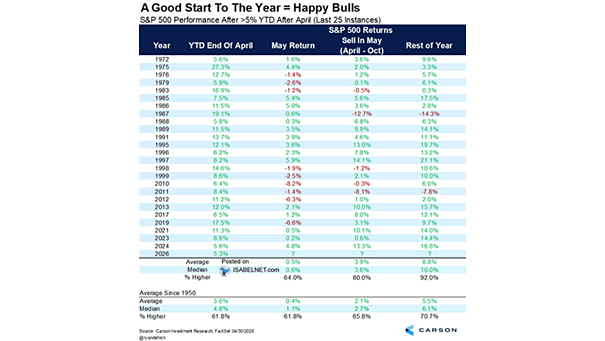
S&P 500 Performance After >5% YTD After April

S&P 500 Performance After >5% YTD After April Since 1972, when the S&P 500 has been up more than 5% heading into May, it has ended the year higher 92% of the time, with a median gain of 10%. No wonder the bulls like those odds. Image: Carson Investment Research

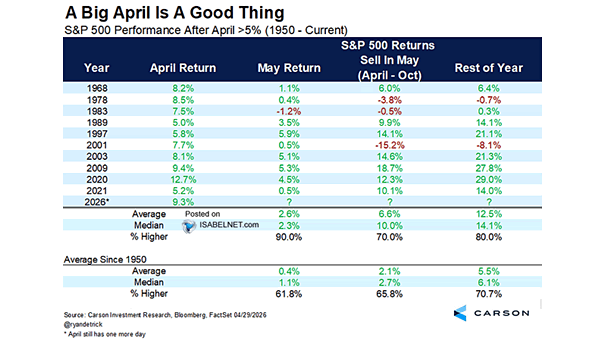
S&P 500 Performance After April >5%

S&P 500 Performance After April >5% Since 1950, a 5%+ April rally has set the tone: May has risen 90% of the time, and the rest of the year has posted a median return of 14.1%, giving bulls a solid tailwind. Image: Carson Investment Research

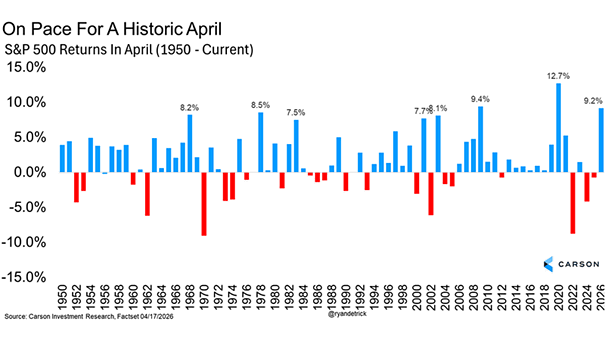
S&P 500 Returns in April

S&P 500 Returns in April With a 10.4% gain, the S&P 500 just posted its second-strongest April since 1950, a powerful boost that often spills into the rest of the year, especially alongside new highs. Image: Carson Investment Research

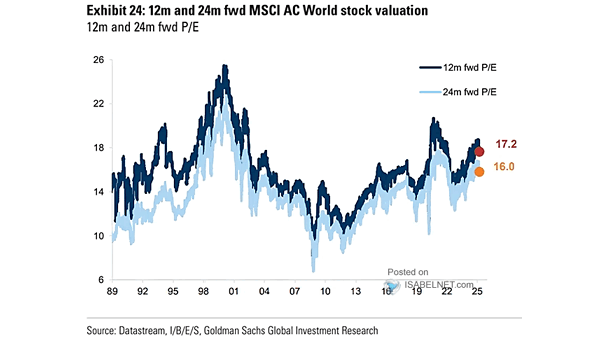
Valuation – MSCI World 12-Month Forward P/E

Valuation – MSCI World 12-Month Forward PE With global equities trading at 18.5 times forward earnings, valuations look stretched by historical standards. Not a bubble, but far from cheap. Image: Goldman Sachs Global Investment Research
Annual Average IPO Return During First Trading Day

Annual Average IPO Return During First Trading Day In 2026, U.S. IPOs rose 19% on average in their first trading session, edging above the 30-year median and delivering a solid first-day pop. Image: Goldman Sachs Global Investment Research