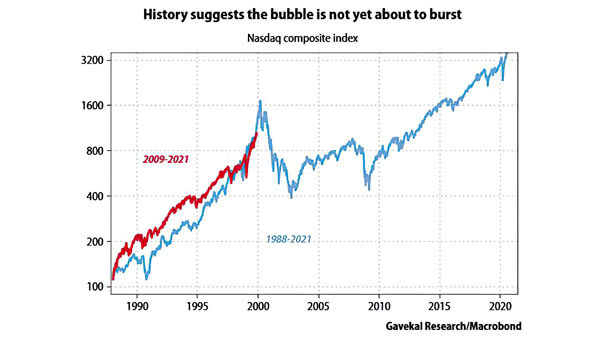
Nasdaq Composite Index – 2009-2021 vs. 1988-2021
Nasdaq Composite Index – 2009-2021 vs. 1988-2021 History suggests the tech bubble is not yet expected to pop. Image: Gavekal, Macrobond
Nasdaq Composite Index – 2009-2021 vs. 1988-2021 History suggests the tech bubble is not yet expected to pop. Image: Gavekal, Macrobond
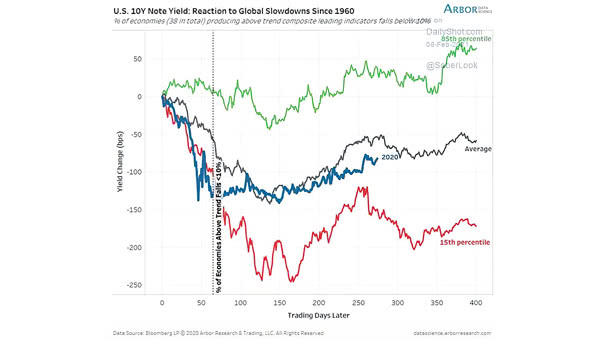
U.S. 10-Year Note Yield – Reaction to Global Slowdowns Since 1960 Global slowdowns do not occur often. The U.S. 10-year Treasury note yield is currently following the average historical trend. Image: Arbor Research & Trading LLC
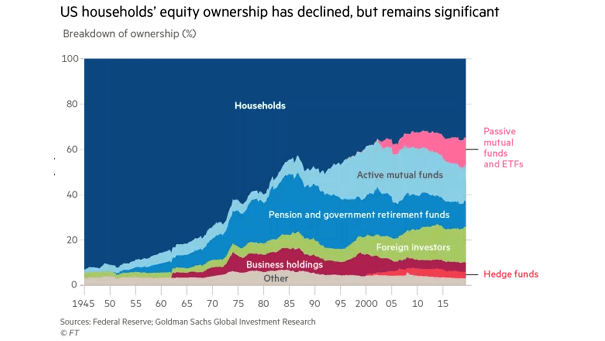
Breakdown of Equity Ownership U.S. households’ equity ownership remains high. Image: Financial Times
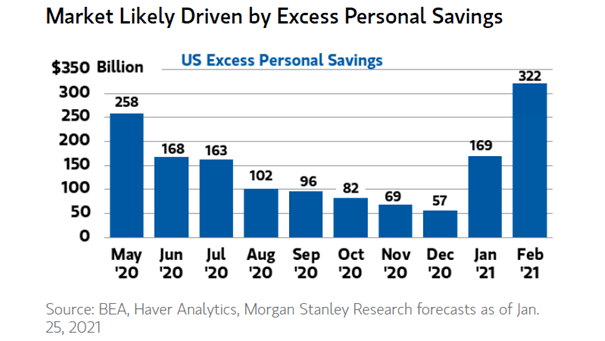
Market and U.S. Excess Personal Savings The market is likely driven by excess personal savings. Image: Morgan Stanley Wealth Management
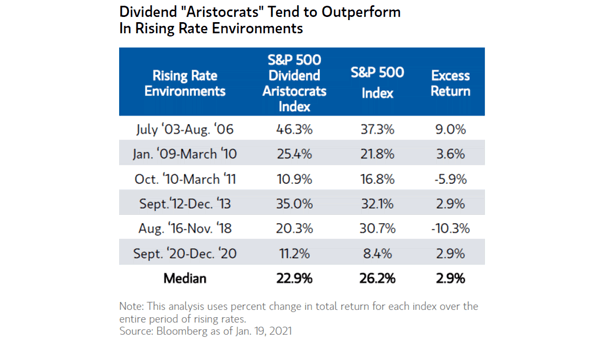
Rising Rate Environments – S&P 500 Dividend Aristocrats vs. S&P 500 Index Rising rate environments tend to favor dividend aristocrats. Image: Morgan Stanley Wealth Management
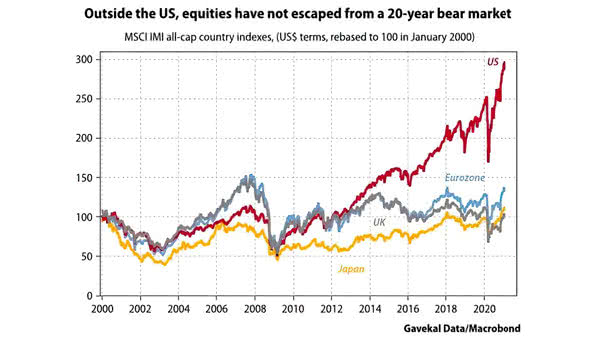
Bear Market – MSCI IMI All-Cap Country Indexes Outside the United States, will the 20-year bear market come to an end? Image: Gavekal, Macrobond
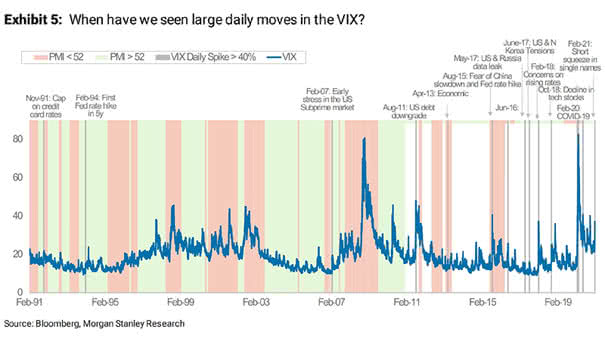
VIX Daily Spike Above 40% and PMI Large daily moves in the VIX tend to be more frequent in recent years. Image: Morgan Stanley Research
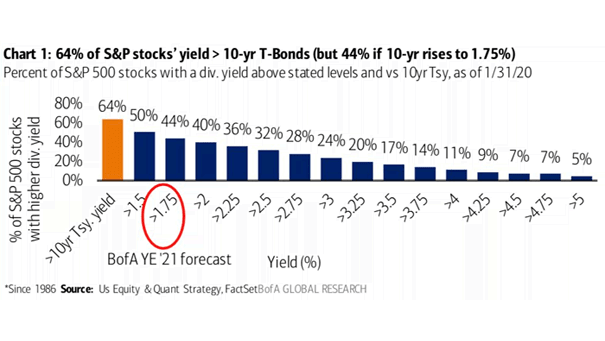
Percent of S&P 500 Stocks with a Dividend Yield Above Stated Levels vs. 10-Year Treasury Yield If the 10-year yield rises to 1.75% by year-end, only 44% of S&P 500 stocks will have a dividend yield higher than the 10-year Treasury yield. Image: BofA US Equity & Quant Strategy
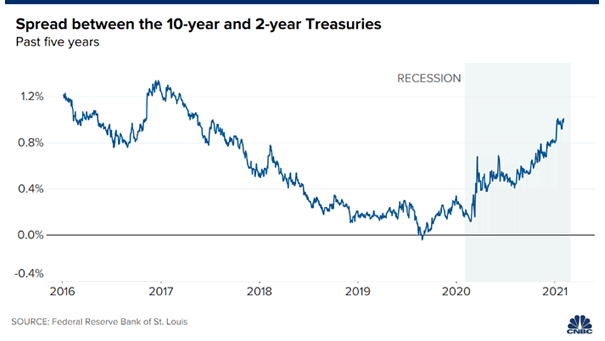
U.S. Yield Curve – Spread Between the 10-Year and 2-Year Treasuries A steepening yield curve suggests a stronger economic growth and rising inflation. Image: CNBC
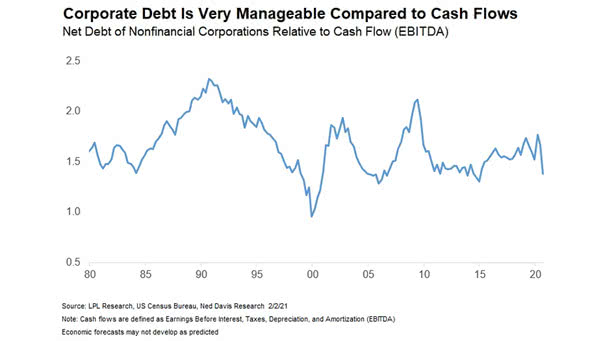
Net Debt of Nonfinancial Corporations Relative to Cash Flow Companies have significant cash flow to cover their debt obligations. Image: LPL Research
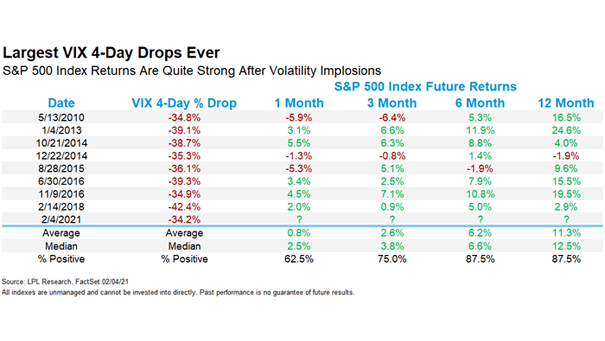
Largest VIX 4-Day Drops Ever Large drops in the VIX tend to push the S&P 500 higher. Image: LPL Research