S&P 500 Financials Index/S&P 500 Index and ISM Manufacturing PMI
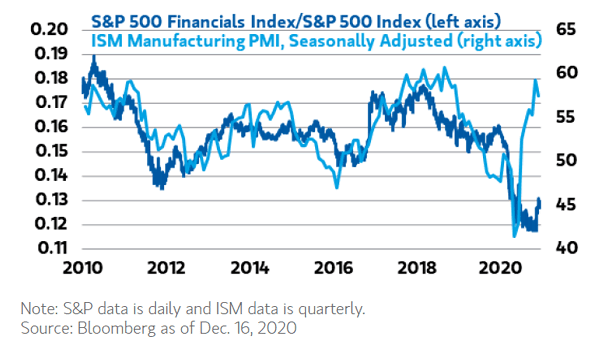
S&P 500 Financials Index/S&P 500 Index and ISM Manufacturing PMI The ISM Manufacturing PMI suggests that the financials’ rally should continue. Image: Morgan Stanley Wealth Management
S&P 500 Financials Index/S&P 500 Index and ISM Manufacturing PMI The ISM Manufacturing PMI suggests that the financials’ rally should continue. Image: Morgan Stanley Wealth Management
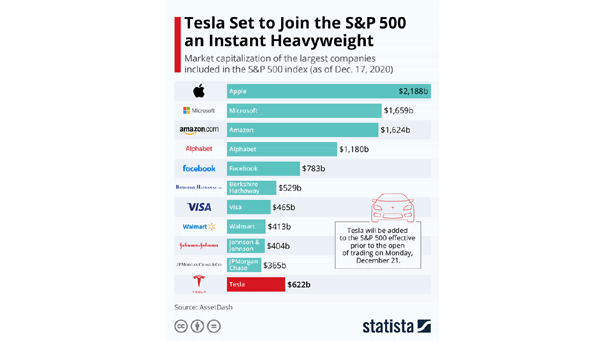
Market Capitalization of the Largest Companies Included in the S&P 500 Index Tesla is the largest company to be added to the S&P 500 index. Image: Statista
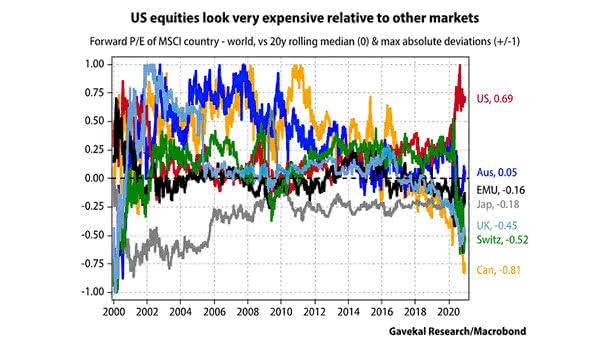
Valuation – U.S. Equities vs. Other Markets U.S. equities at 0.69, look very expensive relative to other markets. Image: Gavekal, Macrobond
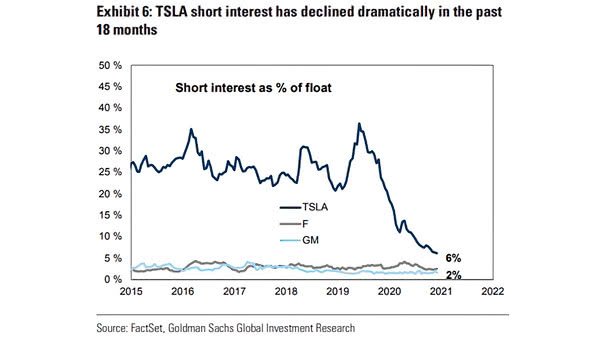
Stocks – Tesla Short Interest as % of Float Tesla’s short sellers have lost billions of dollars this year. Image: Goldman Sachs Global Investment Research
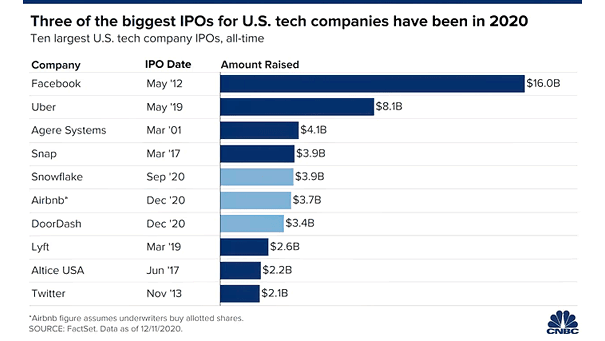
Ten Largest U.S. Tech Company IPOs IPOs are benefiting from the new bull market, as three of the 10 largest U.S. tech IPOs have happened this year. Image: CNBC
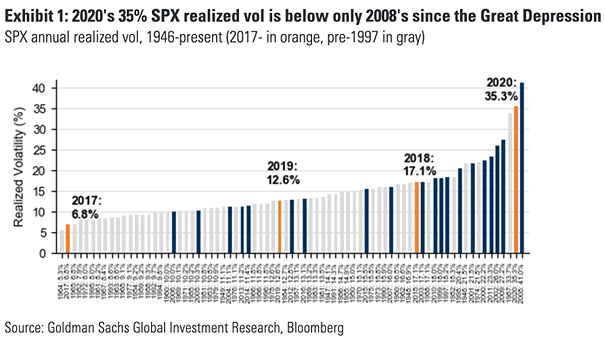
S&P 500 Annual Realized Volatility Since 1946 2020 has been one of the most volatile year for the S&P 500 since 1946. Image: Goldman Sachs Global Investment Research
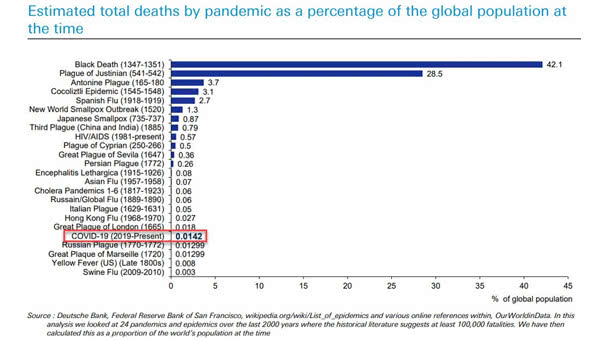
Coronavirus – Estimated Total Deaths by Pandemic as a Percentage of the Global Population at the Time This chart shows how the COVID-19 pandemic compares historically with other pandemics. Image: Deutsche Bank
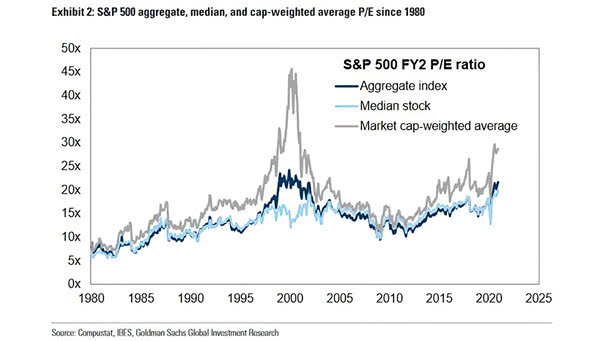
Valuation – S&P 500 FY2 P/E Ratio – Aggregate Index, Median Stock, and Market Cap-Weighted Average P/E Since 1980 The S&P500 aggregate P/E ratio is now in the 99th percentile. Image: Goldman Sachs Global Investment Research
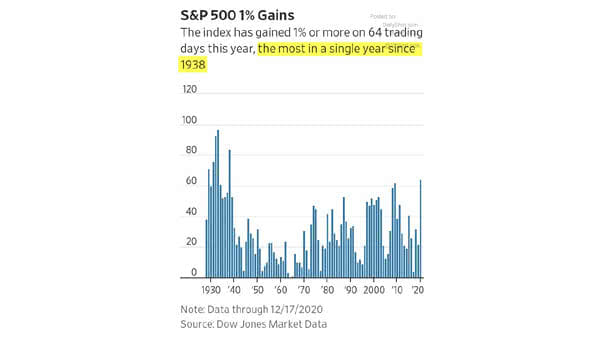
Performance – S&P 500 1% Gains The S&P 500 index has gained 1% or more on 64 trading days in 2020. This is a record since 1938. Image: The Wall Street Journal
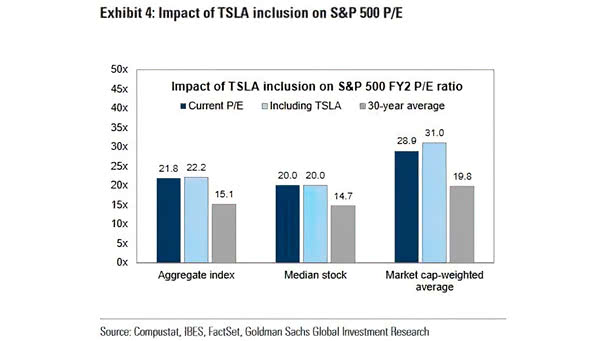
Valuation – Impact of Tesla Inclusion on S&P 500 FY2 P/E Ratio The impact of Tesla inclusion on the S&P 500 market cap-weighted P/E ratio is significant. Image: Goldman Sachs Global Investment Research
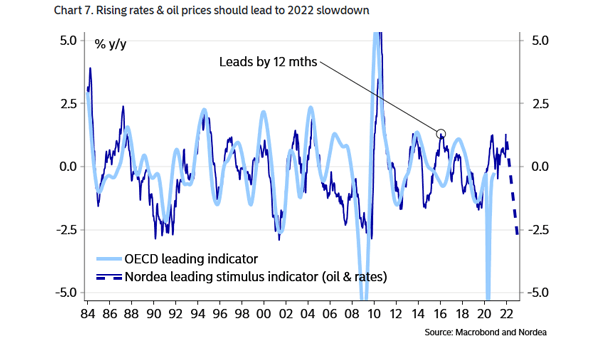
OECD Leading Indicator and Leading Stimulus Indicator (Oil and Rates) Changes in oil prices and yields could have an impact on the OECD leading indicator during the year 2022. Image: Nordea and Macrobond