Performance vs. S&P 500 MSCI Emerging Market Equity Index and Copper
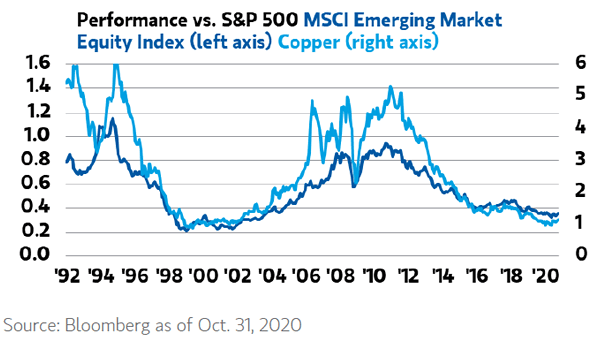
Performance vs. S&P 500 MSCI Emerging Market Equity Index and Copper The rebound in copper prices could suggest strong emerging market performance. Image: Morgan Stanley Research
Performance vs. S&P 500 MSCI Emerging Market Equity Index and Copper The rebound in copper prices could suggest strong emerging market performance. Image: Morgan Stanley Research
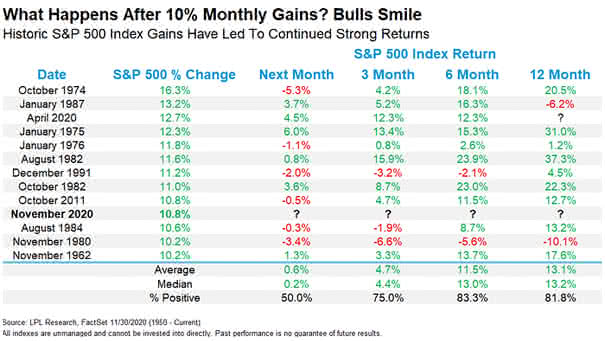
S&P 500 Returns – What Happens After 10% Monthly Gains? Historically, after 10% monthly gains, the S&P 500 tends to be positive over 6 and 12 months. Image: LPL Research
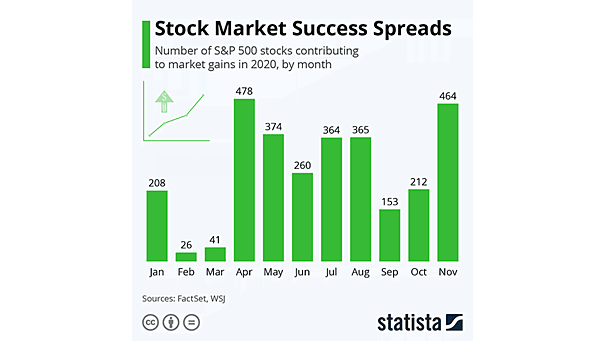
Number of S&P 500 Stocks Contributing to Market Gains in 2020 464 stocks in the S&P 500 closed positively in November. Will the trend continue in December? Image: Statista
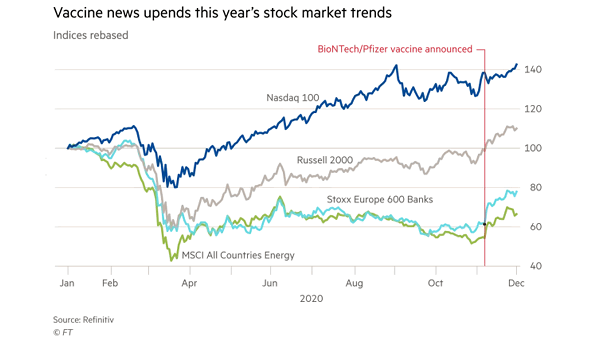
Performance – Nasdaq 100, Russell 2000, Stoxx Europe 600 Banks, MSCI All Countries Energy Welcome to the ‘everything rally’, despite the damage of the coronavirus pandemic on the global economy. Image: Financial Times
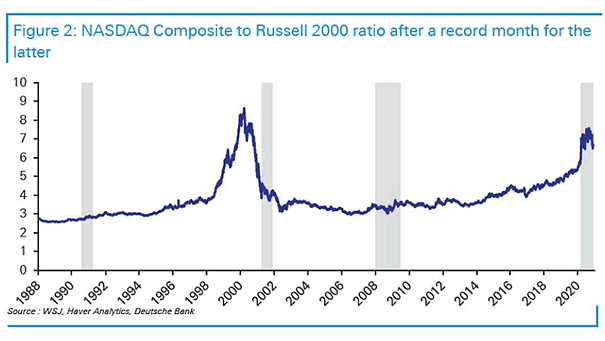
Nasdaq Composite to Russell 2000 Ratio Is it the start of a long reversal? Image: Deutsche Bank
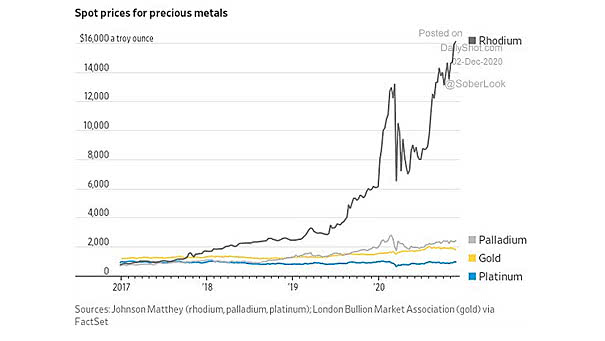
Performance – Prices for Precious Metals Should investors buy rhodium? Rhodium prices are soaring amid tight supply. Image: The Wall Street Journal
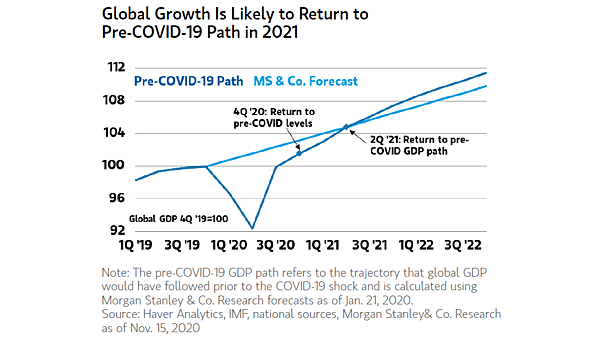
Global GDP Forecast – Return to Pre-COVID-19 GDP Path Morgan Stanley expects global GDP to return to pre-COVID-19 GDP path by 2Q21. Image: Morgan Stanley Research
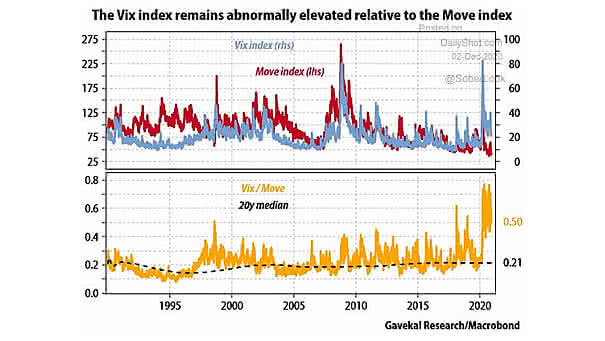
Volatility Divergence – VIX and MOVE The volatility divergence between VIX and MOVE remains elevated. Image: Gavekal, Macrobond
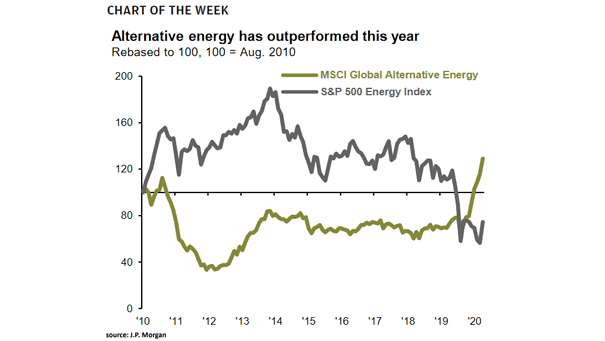
MSCI Global Alternative Energy and S&P 500 Energy Index Alternative energy stocks have risen 69% YTD, but traditional energy stocks have fallen 37%, while 85% of energy still comes from fossil fuels. Image: J.P. Morgan Asset Management
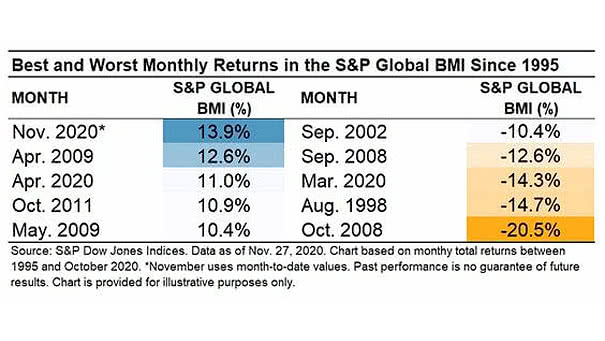
Returns in the S&P Global BMI (Broad Market Index) Since 1995 Market returns in November were very high. Could investors see a Santa Claus rally? Image: S&P Dow Jones Indices
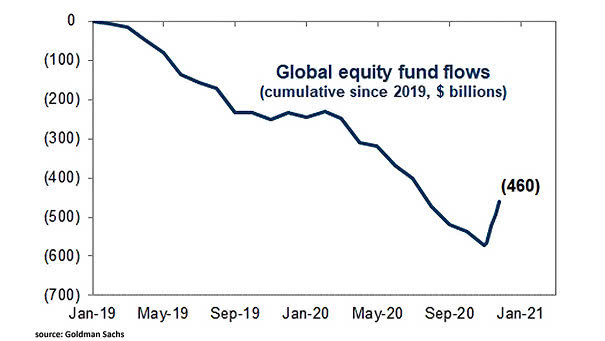
Global Equity Fund Flows Since 2019 This chart puts into perspective inflows to global equity funds in November. Image: Goldman Sachs Global Investment Research