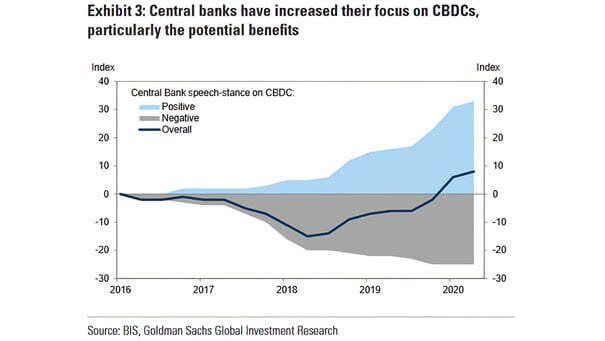
Central Bank Speech-Stance on Central Bank Digital Currencies (CBDC)
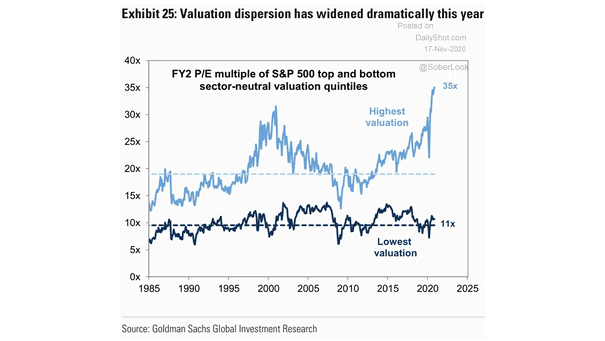
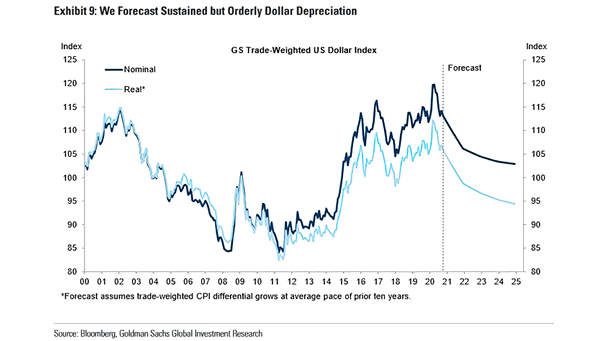
Central Bank Speech-Stance on Central Bank Digital Currencies (CBDC) Central bank digital currencies (CBDC) are now more popular than ever. Image: Goldman Sachs Global Investment Research