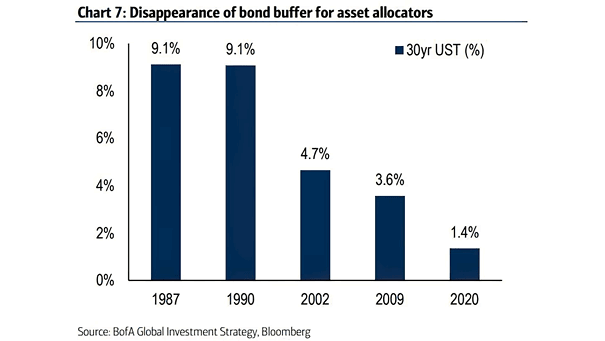
U.S. 30-Year Treasury Yield and Asset Allocation
U.S. 30-Year Treasury Yield and Asset Allocation In a low yield environment, does a 40% bond allocation still make sense? Image: BofA Global Investment Strategy
U.S. 30-Year Treasury Yield and Asset Allocation In a low yield environment, does a 40% bond allocation still make sense? Image: BofA Global Investment Strategy
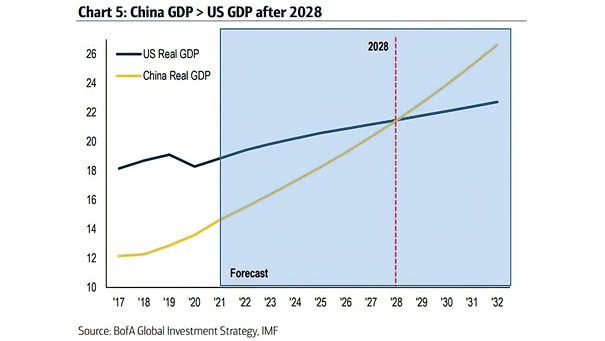
China Real GDP vs. U.S. Real GDP Chart suggesting that China real GDP will overtake U.S. real GDP after 2028. Image: BofA Global Investment Strategy
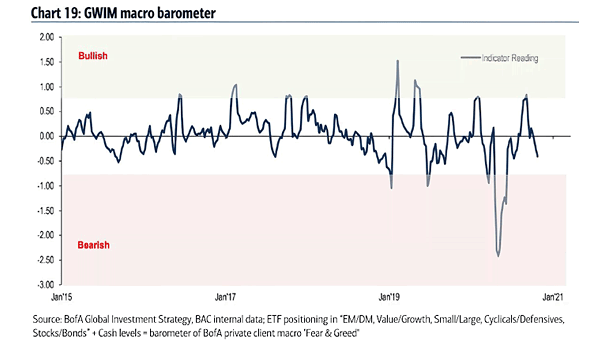
GWIM Macro Sentiment Barometer The GWIM macro sentiment barometer has turned negative. Image: BofA Global Investment Strategy
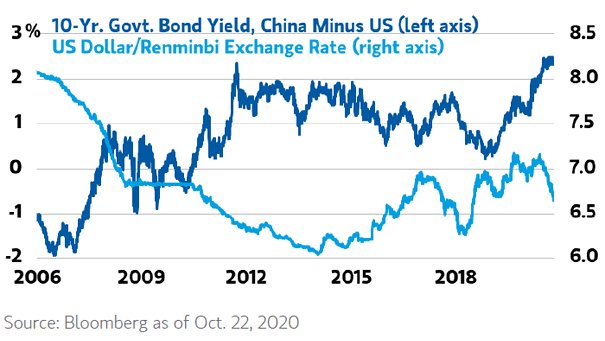
U.S. Dollar/Renminbi Exchange Rate and 10-Year Government Bond Yield, China Minus U.S. China’s yield advantage supports the appreciation of the renminbi. Image: Morgan Stanley Wealth Management
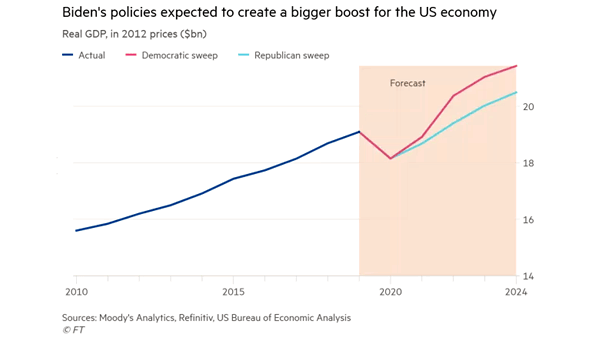
U.S. Real GDP Forecast – Democratic Sweep vs. Republican Sweep This chart suggests what would Trump’s and Biden’s policies mean for U.S. real GDP. Image: Financial Times
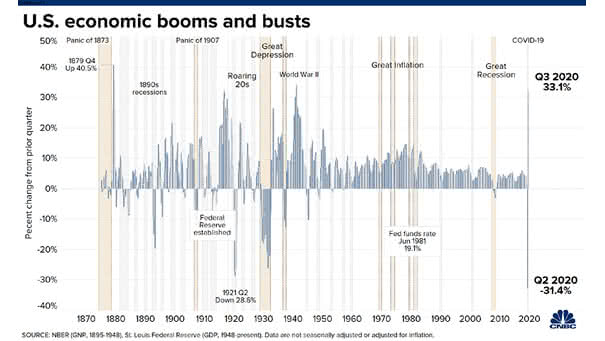
U.S. Real GDP – Economic Booms and Buts U.S. real GDP booms at 33.1% rate in Q3 2020, one of the strongest on record. Image: CNBC
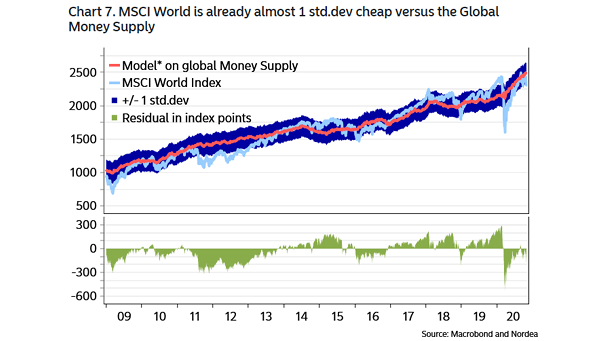
Global Money Supply and MSCI World Index Global equities are around 1 standard devation vs. global money supply. It could be bullish for stocks, as global money supply growth tends to push equities higher. Image: Nordea and Macrobond
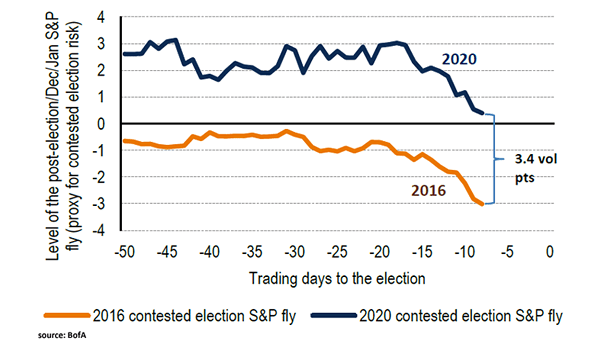
U.S. Election and Contested Election Risk The market’s fear of a contested election is easing. Image: BofA
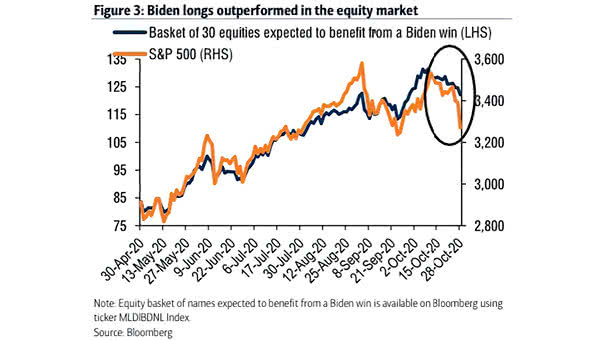
Performance – S&P 500 vs. Basket of 30 Equities Expected to Benefit from a Biden Win Biden longs outperformed in the equity market, as investors are betting on a potential Biden election victory. Image: BofA Global Research
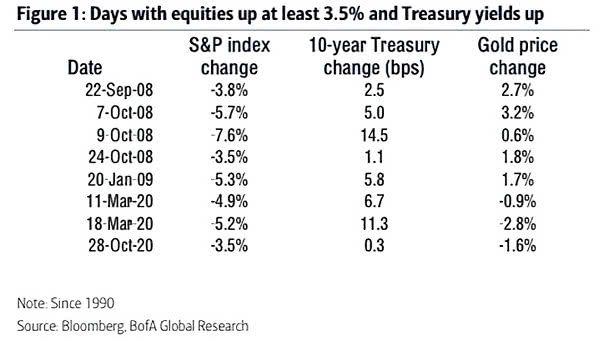
Markets – Days with Equities Up at Least 3.5% and Treasury Yield Up The combination where equities drop at least 3.5%, Treasury yields are up and gold is down, is rare. Image: BofA Global Research
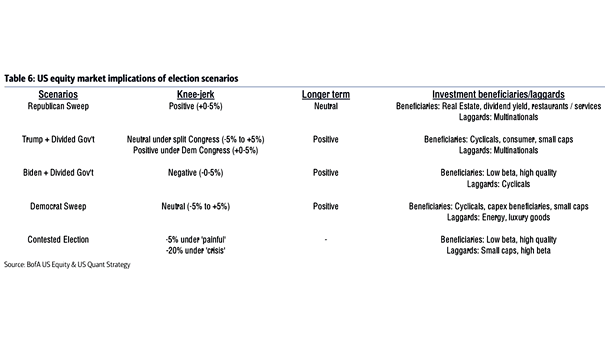
U.S. Equity Market Implications of Election Scenarios Chart suggesting the equity market implications of five possible U.S. election outcomes. Image: BofA Global Research