
Estimated S&P 500 Earnings Impact of Biden Policies
Estimated S&P 500 Earnings Impact of Biden Policies Chart suggesting that there are both upside and downside risks to future S&P 500 earnings. Image: Goldman Sachs Global Investment Research
Estimated S&P 500 Earnings Impact of Biden Policies Chart suggesting that there are both upside and downside risks to future S&P 500 earnings. Image: Goldman Sachs Global Investment Research
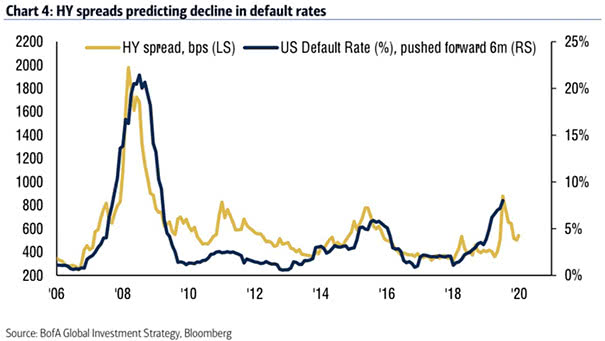
High Yield Spread vs. U.S. Default Rate Current high yield spreads are predicting decline in U.S. default rates. Image: BofA Global Investment Strategy
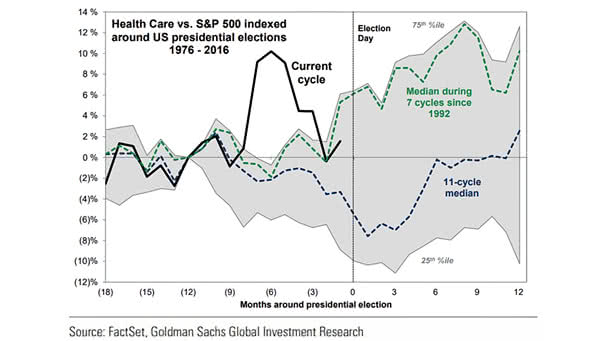
Health Care Sector Excess Returns vs. S&P 500 Around U.S. Presidential Elections The health care sector tends to underperform through U.S. presidential elections, due to uncertainty about future government policy. Image: Goldman Sachs Global Investment Research
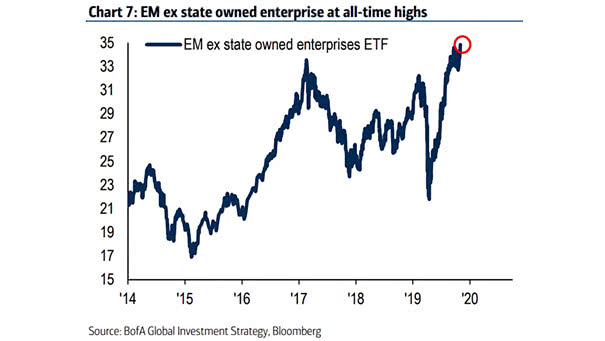
Performance – Emerging Markets Ex State Owned Enterprises ETF Emerging markets ex state owned enterprises ETF is at all-time highs. Image: BofA Global Investment Strategy
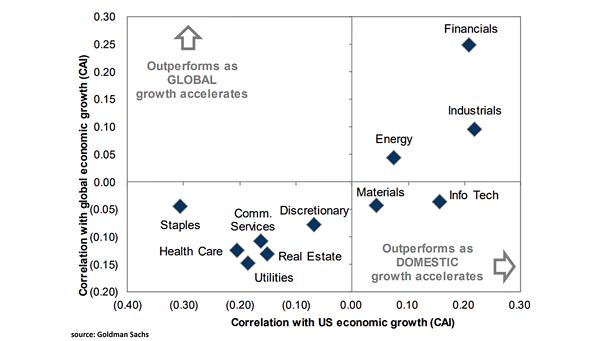
Performance – Sector Sensitivity to U.S. and Global GDP Growth The financial and industrial sectors are the most correlated with global growth. Image: Goldman Sachs Global Investment Research
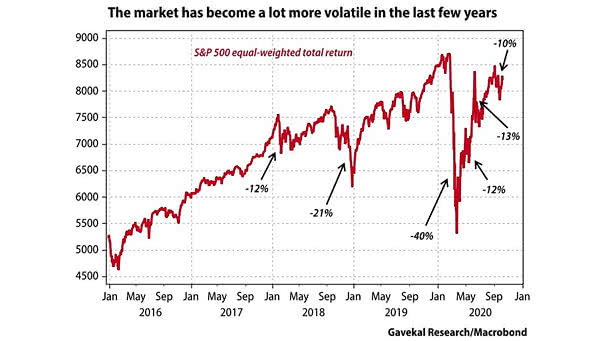
Volatility – S&P 500 Equal-Weighted Total Return Could the U.S. stock market continue to swing wildly? Image: Gavekal, Macrobond
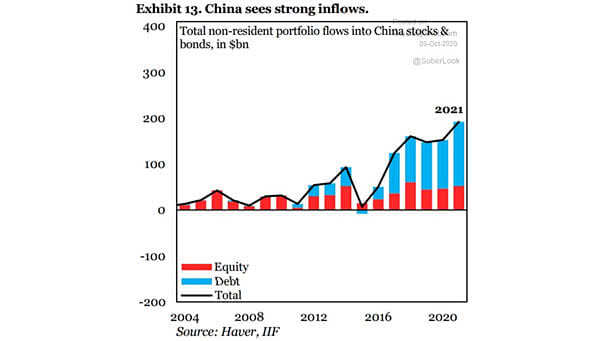
Total Non-Resident Portfolio into China Stocks and Bonds China remains the darling of foreign investors. Image: Institute of International Finance
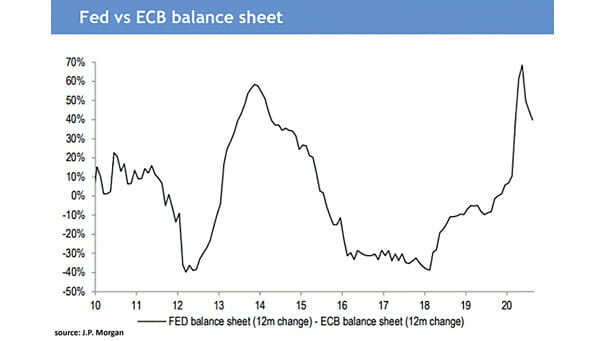
Fed vs. ECB Balance Sheet This chart puts the Fed vs. ECB balance sheet into perspective. Image: J.P. Morgan
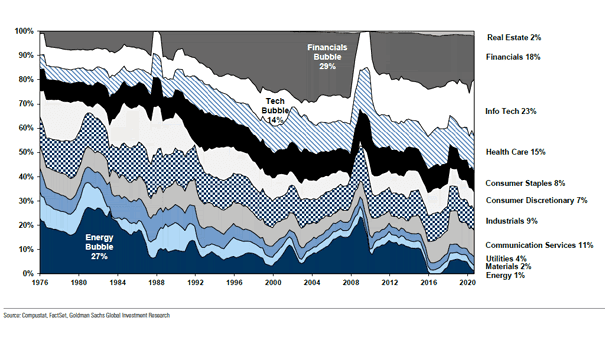
Net Income Contribution by Sector to S&P 500 This chart shows the net income contribution by sector to the S&P 500 over time. Image: Goldman Sachs Global Investment Research
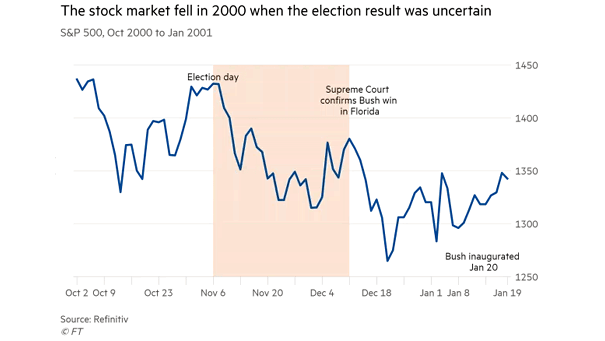
U.S. Election and S&P 500 from October 2000 to January 2001 What could happen to the stock market if there’s no clear winner on presidential Election Day? Image: Financial Times
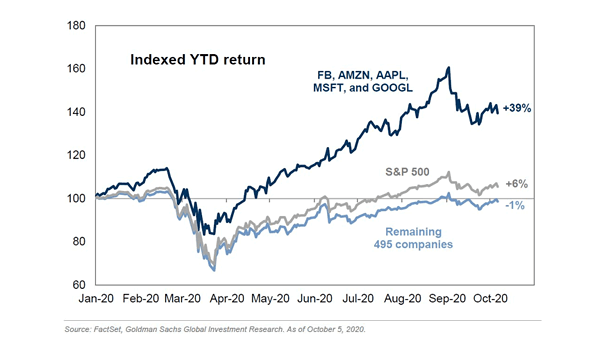
Five Largest Stocks vs. S&P 500 The five largest stocks have returned +39% YTD, while the remaining 495 stocks have returned -1%. Image: Goldman Sachs Global Investment Research