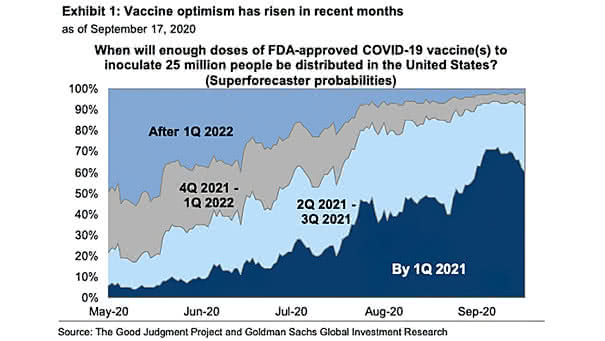
Coronavirus Vaccine in the U.S.
Coronavirus Vaccine in the U.S. A vaccine for Covid-19 will accelerate the path to economic normalization. Image: Goldman Sachs Global Investment Research
Coronavirus Vaccine in the U.S. A vaccine for Covid-19 will accelerate the path to economic normalization. Image: Goldman Sachs Global Investment Research
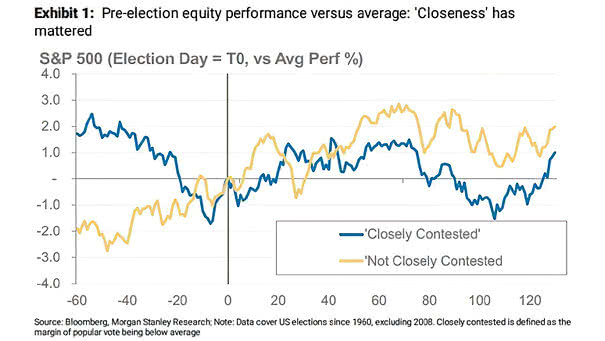
U.S. Elections – Pre-election Equity Performance vs. Average Chart showing how the U.S. stock market has performed before and after presidential elections (“Closely contested” is defined as the margin of popular vote being below average). Image: Morgan Stanley Research
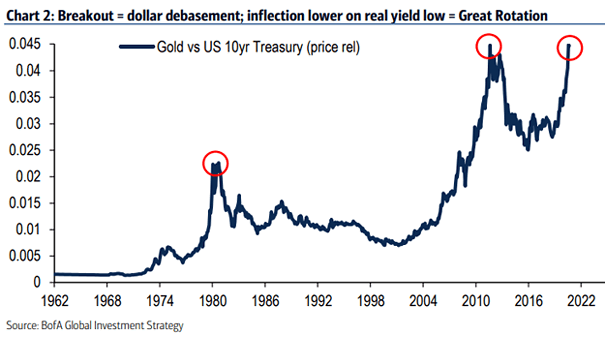
Gold vs. U.S. 10-Year Treasury Is the U.S. dollar debasement a myth? What really matters for gold are real interest rates. Image: BofA Global Research
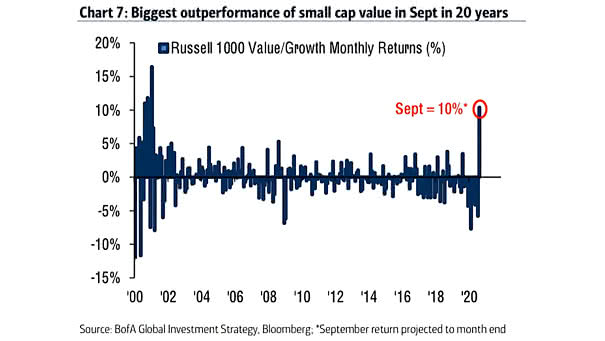
Performance – Russell 1000 Value/Growth Month Returns This month sees the strongest outperformance in small cap value since the 2000s (September return projected to month end). Image: BofA Global Investment Strategy
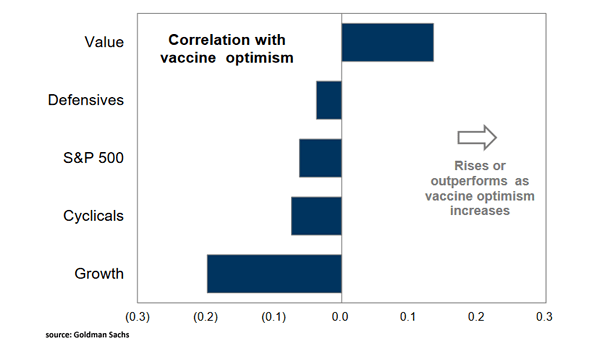
Correlation with Vaccine Optimism (Value, Defensives, S&P 500, Cyclicals and Growth) Value could outperform as vaccine optimism increases. Image: Goldman Sachs Global Investment Research
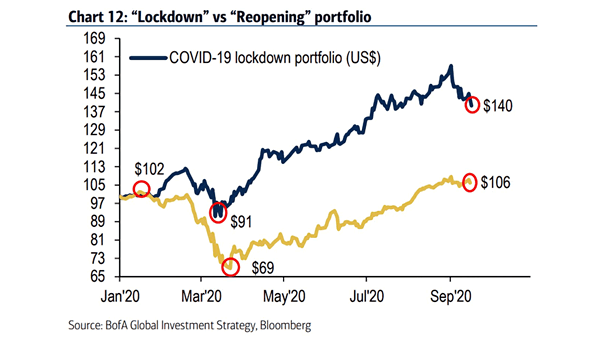
COVID-19 Lockdown Portfolio vs. COVID-19 Reopening Portfolio (Coronavirus) Since January 2020, the COVID-19 “lockdown portfolio” has outperformed the COVID-19 “reopening portfolio.” Image: BofA Global Investment Strategy
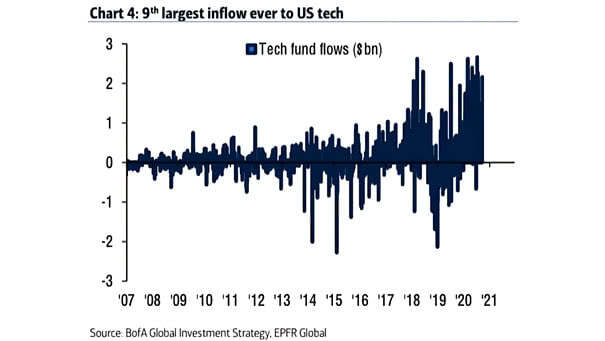
Tech Inflows Investors continue to rush into tech, despite the growing concerns of a potential bubble forming in the tech sector. Image: BofA Global Investment Strategy
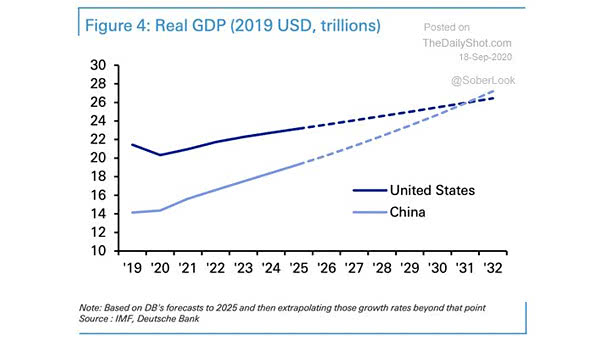
Real GDP – China vs. U.S. Chart suggesting that China real GDP will overtake U.S. real GDP by 2031. Image: Deutsche Bank
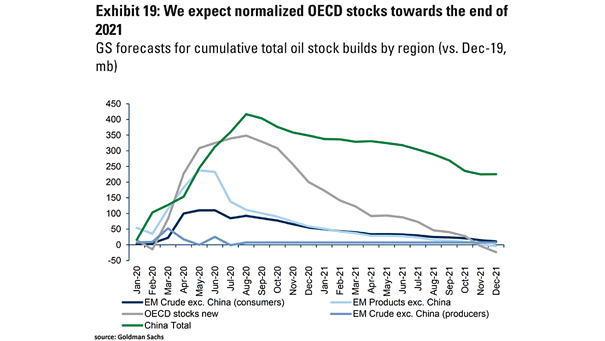
Forecasts for Cumulative Total Oil Stock Builds by Region The Goldman Sachs forecast remains unchanged for Brent at $65/bbl by 3Q 2021. Image: Goldman Sachs Global Investment Research
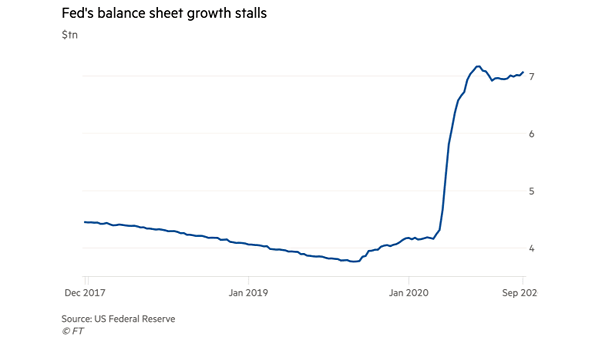
Fed’s Balance Sheet Growth The growth of the Fed’s balance sheet has a good correlation with the S&P 500 since 2009. How will the U.S. stock market do the rest of the year? Image: Financial Times
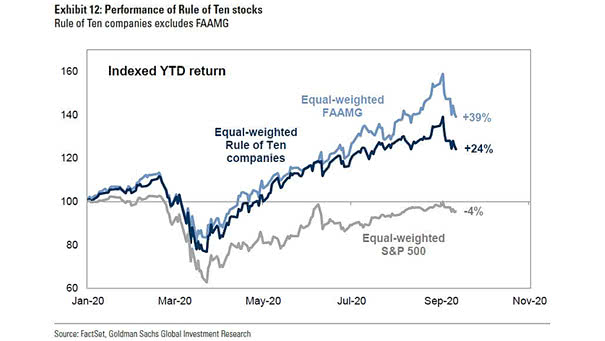
Performance of Rule of Ten Stocks vs. Equal-Weighted S&P 500 The equal-weighted basket of “Rule of Ten” stocks has returned 24% YTD, compared with -4% for the equal-weighted S&P 500 and 39% for the equal-weighted FAAMG. Image: Goldman Sachs Global Investment Research