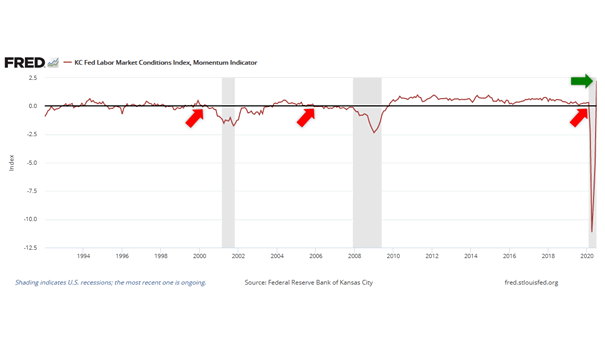
Gold vs. Silver
Gold vs. Silver Gold approaches record as silver prices surge to highest levels in years, amid growing coronavirus fears. Image: The Daily Shot
Cross Asset Flows As the chart shows, equity flows have been particularly weak in the last 12 months. Image: Deutsche Bank Asset Allocation
Performance – S&P 500 vs. Nasdaq Will the Nasdaq continue to outperform the S&P 500? Image: The Daily Shot
10-Year U.S. Treasury Yield vs. Cyclical to Defensives Stock Ratio The divergence between the 10-year U.S. Treasury yield and the cyclical to defensives stock ratio suggests higher yields ahead. Image: Morgan Stanley Research
Seasonality – Average Monthly Total Return for the S&P 500 Index and Statistical Significance Over the past 20 years, July has been positive on average with a high confidence level. Image: Morgan Stanley Research
U.S. Labor Market Recovery Chart suggesting that the U.S. labor market recovery is stalling. Image: Goldman Sachs Global Investment Research
Coronavirus – U.S. Infections Outlook U.S. infections are expected to peak by mid-August. Image: Gavekal, Macrobond
S&P 500 Performance During Regular Trading Hours vs. Extended Hours Chart showing the performance divergence between regular trading hours and extended hours. Image: J.P. Morgan
Fiscal Policy Easing Response to Coronavirus Crisis The U.S. fiscal response to the coronavirus crisis is massive. Image: Goldman Sachs Global Investment Research
Ownership of U.S. Equities by Age Group Young individuals are less likely than their elders to own U.S. equities. Image: Goldman Sachs Global Investment Research
Use of Cash Is this the end of cash? The use of cash is declining faster than it did before the coronavirus pandemic. Image: Deutsche Bank Research