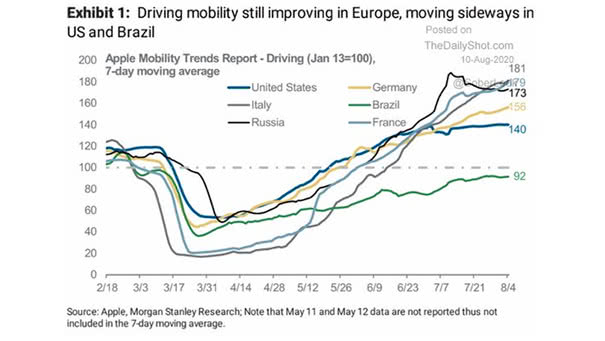
Indicator – Driving Mobility
Indicator – Driving Mobility Driving mobility is improving overall. Image: Morgan Stanley Research
Indicator – Driving Mobility Driving mobility is improving overall. Image: Morgan Stanley Research
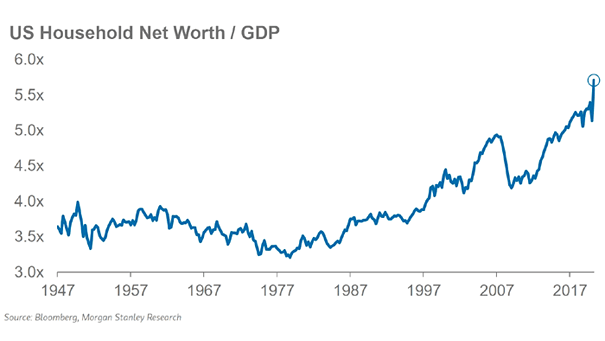
U.S. Household Net Worth to GDP Rich people are getting richer during the coronavirus pandemic. U.S. household net worth to GDP hit a new record high. Image: Morgan Stanley Research
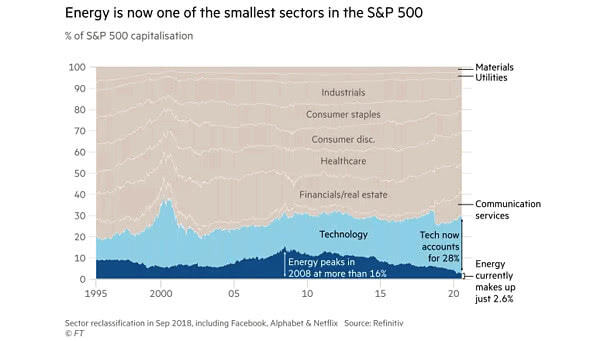
% of S&P 500 Capitalization Currently, the energy sector accounts for only 2.6% of the S&P 500’s capitalization, while tech now accounts for 28%. Image: Financial Times
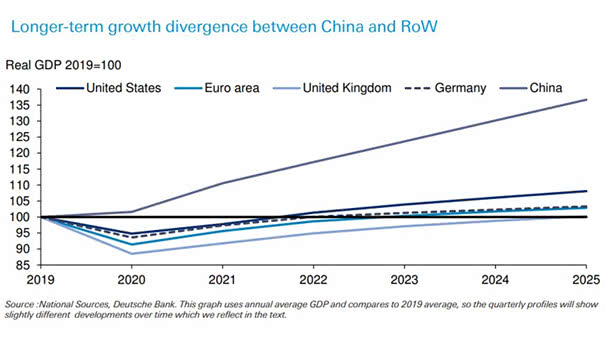
China GDP – Longer-Term Growth Divergence Between China and the Rest of the World The divergence between China and the rest of the world is expecting to increase over time. Image: Deutsche Bank
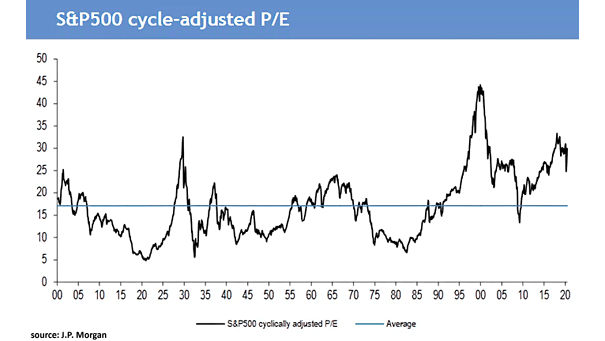
S&P 500 Cycle-Adjusted P/E The S&P500 cycle-adjusted P/E is now 29.9 and 75% above its long-term average, suggesting weak equity returns over the next 10 years. Image: J.P. Morgan
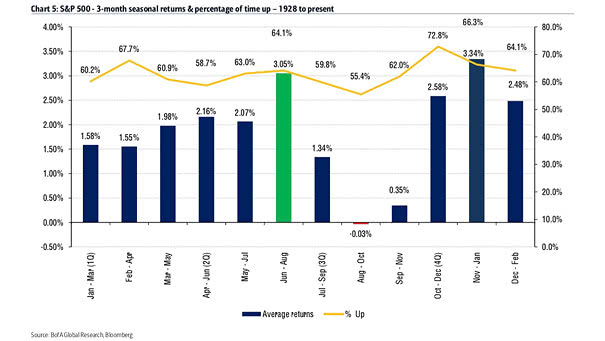
S&P 500 and 3-Month Seasonality The S&P 500 tends to get a summer rally, as the second strongest 3-month period of the year is June-August, with an average return of 3.05%. Image: BofA Global Research
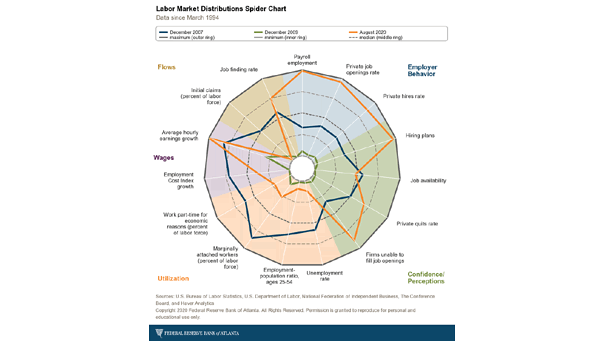
U.S. Labor Market Distributions Spider Chart The U.S. labor market distributions spider chart shows broad labor market developments. Image: Federal Reserve Bank of Atlanta
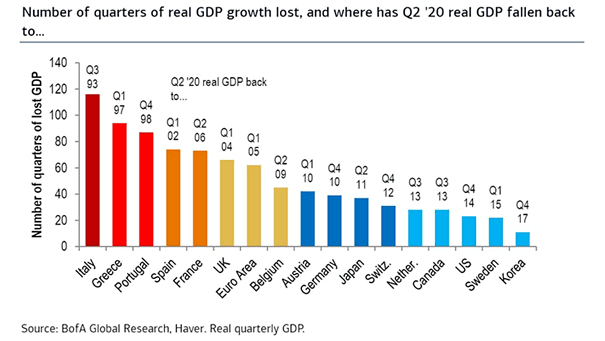
Number of Quarters of Real GDP Growth Lost This chart highlights the large gap between countries in terms of real GDP growth lost. Image: BofA Global Research
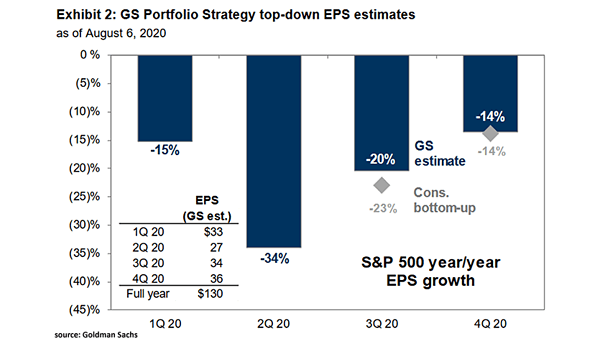
S&P 500 YoY EPS Growth Estimate Goldman Sachs has raised its 2020 S&P 500 EPS estimate from $115 to $130. Image: Goldman Sachs Global Investment Research
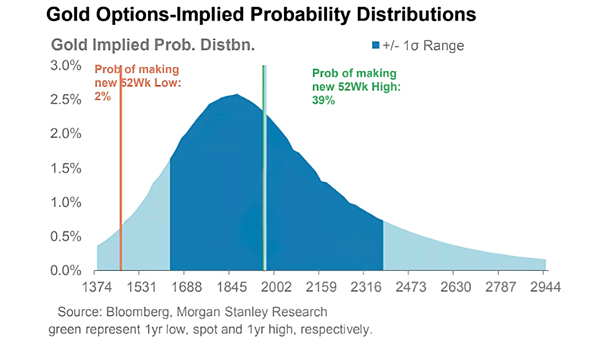
Gold Options-Implied Probability Distributions Option markets are quite bullish on gold. Image: Morgan Stanley Research
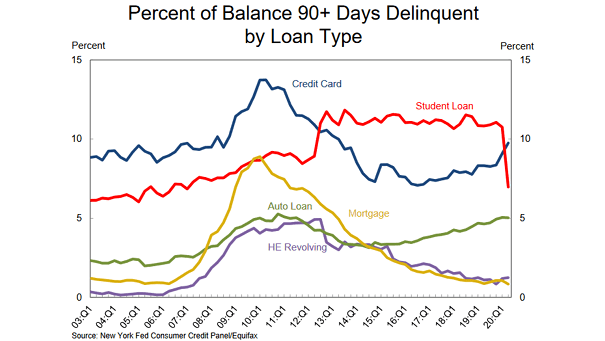
U.S. Household Debt and Credit Aggregate household debt balances declined by $34bn and stand at $14.27tn. This is the first decline since 2014. Image: Federal Reserve Bank of New York