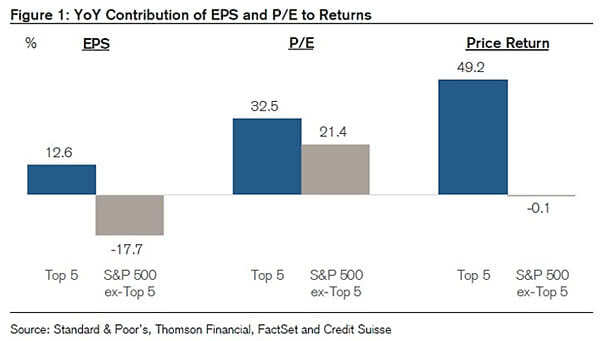
Top 5 vs. S&P 500 ex-Top 5 – YoY Contribution of EPS and P/E to Returns
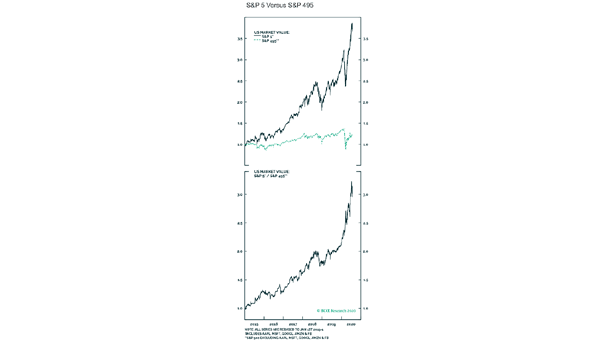
Top 5 vs. S&P 500 ex-Top 5 – YoY Contribution of EPS and P/E to Returns The performance gap could widen further, as the top 5 largest stocks in the S&P 500 are superior on almost every financial metric (revenue, profit growth, margin structure, volatility and corporate leverage). Image: Credit Suisse Research