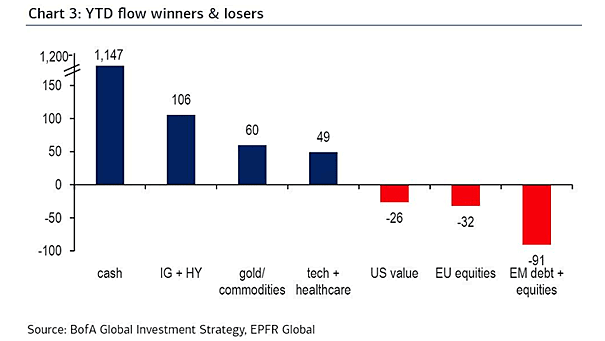
YTD Flow Winners and Losers
YTD Flow Winners and Losers Equities have seen billions in outflows year-to-date. Image: BofA Global Investment Strategy
YTD Flow Winners and Losers Equities have seen billions in outflows year-to-date. Image: BofA Global Investment Strategy
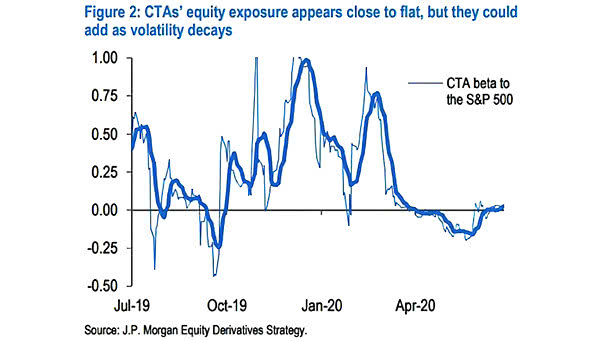
CTAs’ Equity Exposure (CTA Beta to the S&P 500) CTAs’ equity exposure is currently flat. Image: J.P. Morgan Equity Derivatives Strategy
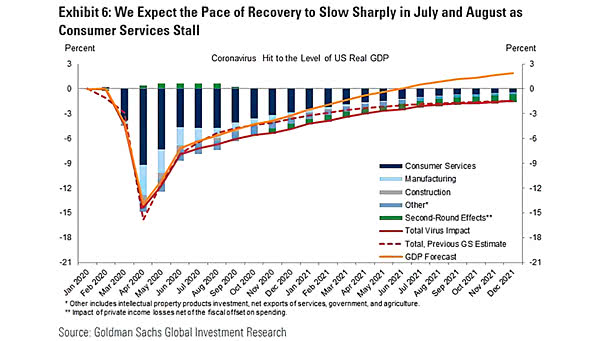
U.S. Real GDP Forecast Goldman Sachs revised its U.S. real GDP growth forecast. Image: Goldman Sachs Global Investment Research
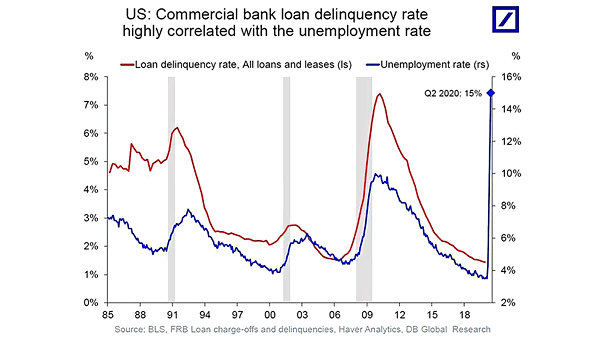
Commercial Bank Loan Delinquency Rate Chart suggesting that the commercial bank loan delinquency rate is expected to rise Image: Deutsche Bank Global Research
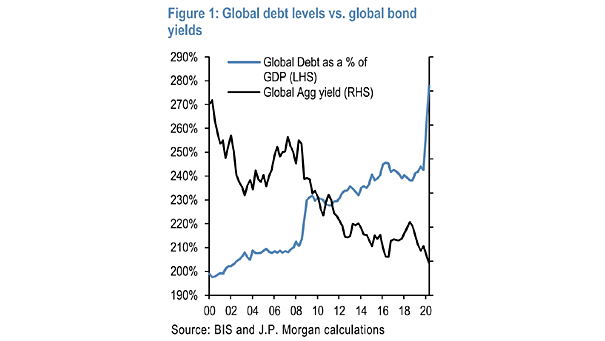
Global Debt Levels vs. Global Bond Yields Global debt is at all-time high, while global bond yields are at all-time low. Image: J.P. Morgan
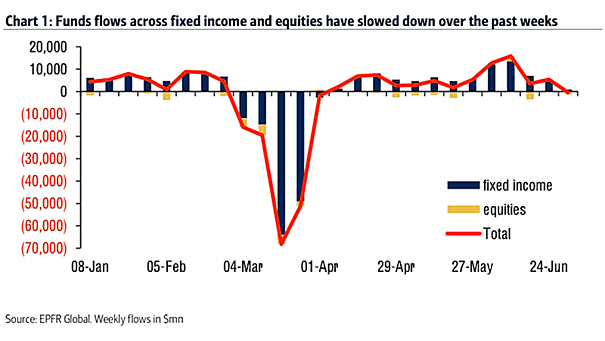
Funds Flows – Fixed Income and Equities Funds flows across fixed income and equities continued to slow for a third week. Image: BofA Global Research
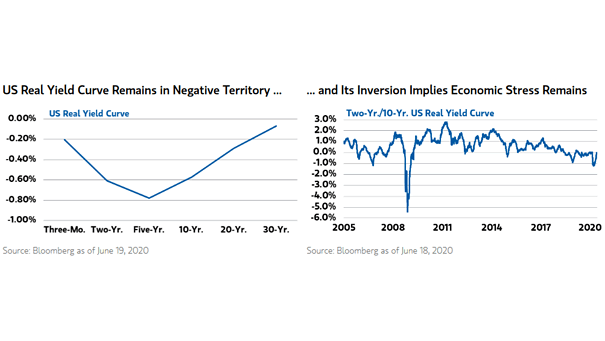
U.S. Real Yield Curve and 2-Year/30-Year U.S. Real Yield Curve Economic stress remains as the U.S. real yield curve remains in negative territory. Image: Morgan Stanley Research
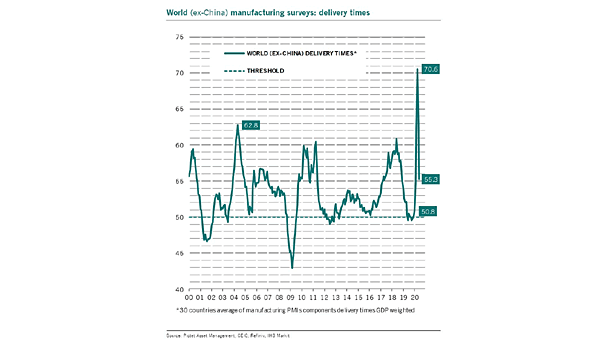
World (ex-China) Manufacturing Surveys – Delivery Times The coronavirus pandemic disrupted global supply chains. This chart suggests that delivery times have now shortened significantly. Image: Pictet Asset Management
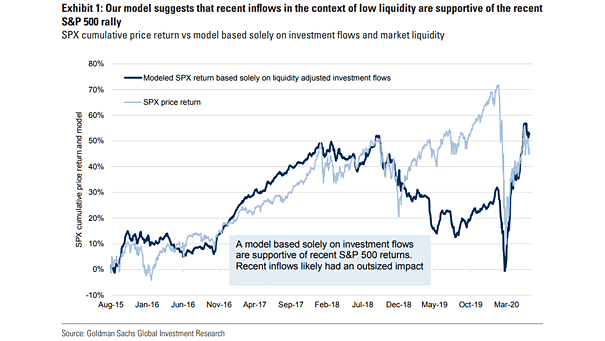
S&P 500 Cumulative Price Return vs. Model Based Solely on Investment Flows and Market Liquidity The analysis from Goldman Sachs suggests that the S&P 500 has underperformed liquidity-adjusted investment flows. Image: Goldman Sachs Global Investment Research
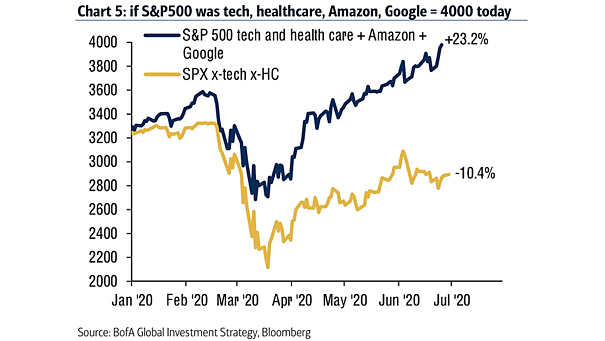
S&P 500 Tech and Health Care + Amazon + Google vs. S&P 500 Excluding Tech and Health Care This chart highlights the outperformance of S&P 500 YTD (tech and health care + Amazon + Google) vs. S&P 500 (excluding tech and excluding health care). Image: BofA Global Investment Strategy
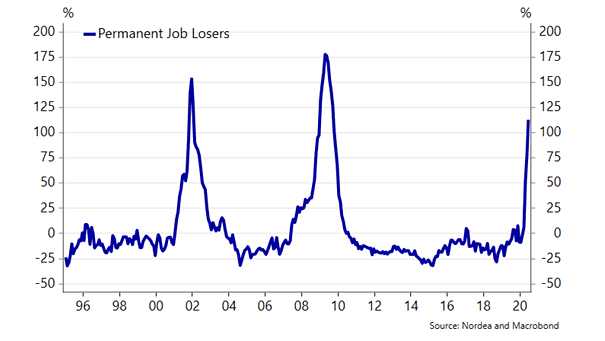
Permanent Job Losers in the U.S. Permanent job losers continued to rise in June. Last time, it took three years for permanent job losses to peak. Image: Nordea and Macrobond