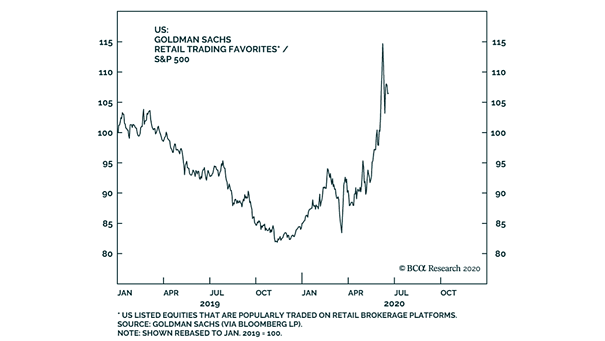
Average Annual U.S. GDP Growth by Administration
Average Annual U.S. GDP Growth by Administration This chart puts into perspective the average annual growth of U.S. GDP by administration. Image: Michael McDonough
Annual U.S. Treasury Purchases by Sector This chart suggests that the Fed and money market mutual funds will buy the vast majority of new Treasury supply this year. Image: Financial Times
Saving – Household Spending as % of Disposable Income and 10-Year Treasury Yield As the chart shows, lower yields force households to save more (hyper-globalization 2001-2020). This is a vicious cycle, as forced saving depresses demand. Image: BofA Research Investment Committee
Small Businesses Very Bearish about the Economic Outlook 40% of small businesses expect a recovery sometime in 2021, and 19% between 2022-2024. Image: Deutsche Bank Global Research
Unemployment Rate by Country vs. 10-Year Average This chart puts into perspective the current unemployment rate by country vs. the 10-year average. Image: Deutsche Bank
Bond Yields, U.S. Dollar and Stock Market According to BofA, the biggest summer pain trade would be a rise in bond yields, a falling U.S. dollar and a sideways stock market. Image: BofA Global Investment Strategy
Copper to Gold Ratio and U.S. 10-Year Bond Yield The copper to gold ratio suggests higher bond yields. Image: Pictet Asset Management
S&P 500 vs. 2023 S&P 500 DPS (Dividend Per Share) This chart suggests that long-dated S&P 500 dividends appear underpriced. Image: Goldman Sachs Global Investment Research
U.S. Initial Claims for Unemployment U.S. new weekly jobless claims fall below 2 million, but remain high. Image: Oxford Economics
Prediction Market Probability That Democrats Have Control Following 2020 Election According to Goldman Sachs, the odds of a “blue wave” in November have risen and could lift the effective S&P 500 tax rate from 18% back to 26%, reducing the 2021 EPS forecast from $170 to $150. Image: Goldman Sachs Global Investment Research
Gold vs. U.S. 10-Year Treasury Real Yield Generally, when U.S. real yields go up, gold goes down. Source: Scotiabank Economics