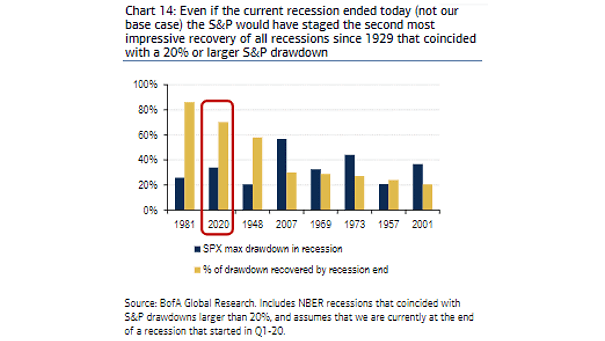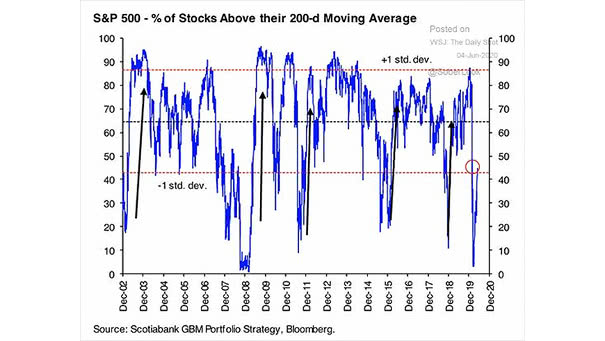
S&P 500 and % of Stocks Above their 200-Day Moving Average
S&P 500 and % of Stocks Above their 200-Day Moving Average More than 90% of S&P 500 stocks are trading above their 50-day moving average, but just 47% are above their 200-day moving average today. This chart suggests there’s room for improvement. Image: Scotiabank GBM Portfolio Strategy