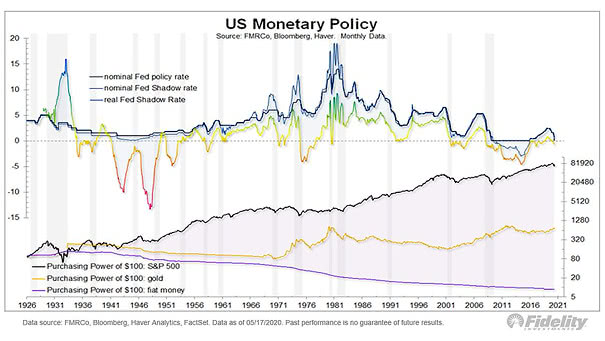
Cash on the Sidelines in Money Market Mutual Funds

Cash on the Sidelines in Money Market Mutual Funds How much cash is sitting in money market mutual funds, waiting to come back to the market? $4.8 trillion, which is about 16% of market capitalization. Image: Fidelity Investments

Inflation Assets vs. Deflation Assets

Inflation Assets vs. Deflation Assets The leadership remains deflationary, and the laggards remain inflationary. Deflation assets: government bonds, U.S. investment grade, S&P 500, U.S. consumer discretionary, growth and US high yield. Inflation assets: TIPS, EAFE, U.S. banks, value and cash. Image: BofA Global Investment Strategy

Change in Global Oil Stocks

Change in Global Oil Stocks Global oil inventory appear to have be peaking. Goldman Sachs forecasts that excess inventories will have peaked at 1,075 mb with a draw of 60 mb in June. Image: Goldman Sachs Global Investment Research

New York Fed’s Weekly Economic Index and U.S. GDP

New York Fed’s Weekly Economic Index and U.S. GDP The New York Fed’s Weekly Economic Index does not bode well for US GDP. This is the fifth consecutive week in negative double digit for the New York Fed’s Weekly Economic Index. Image: Nordea and Macrobond

Gap Between High and Low Valuation Stocks

Gap Between High and Low Valuation Stocks Today, the gap between high and low valuation stocks is the widest since the dotcom bubble. Image: Goldman Sachs Global Investment Research

U.S. Inflation and Oil Prices

U.S. Inflation and Oil Prices The relationship between U.S inflation and oil prices suggests that U.S. inflation could fall further. Image: Jeroen Blokland

Alternative Measures of Consumer Activity

Alternative Measures of Consumer Activity Chart suggesting that activity is starting to pick up in the U.S., as lockdowns are easing after weeks of restrictions. Image: Goldman Sachs Global Investment Research