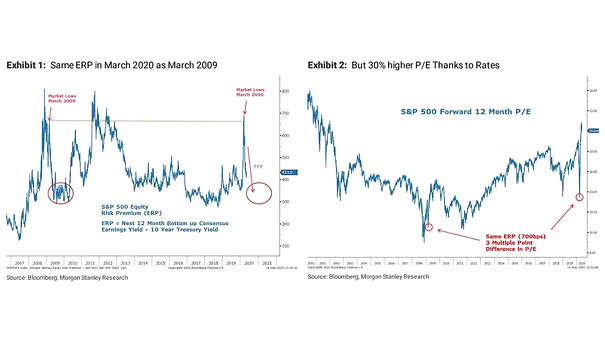
S&P 500 Equity Risk Premium – 2020 vs. 2009
S&P 500 Equity Risk Premium – 2020 vs. 2009 Same equity risk premium in March 2020 as March 2009, but 30% higher P/E thanks to the level of rates. Image: Morgan Stanley Research
S&P 500 Equity Risk Premium – 2020 vs. 2009 Same equity risk premium in March 2020 as March 2009, but 30% higher P/E thanks to the level of rates. Image: Morgan Stanley Research
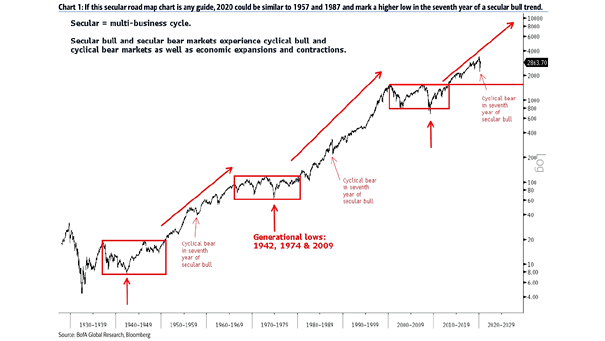
Secular Bull and Secular Bear Markets This year could be similar to 1957 and 1987, suggesting that the secular bull market is still intact for the time being. Image: BofA Global Research
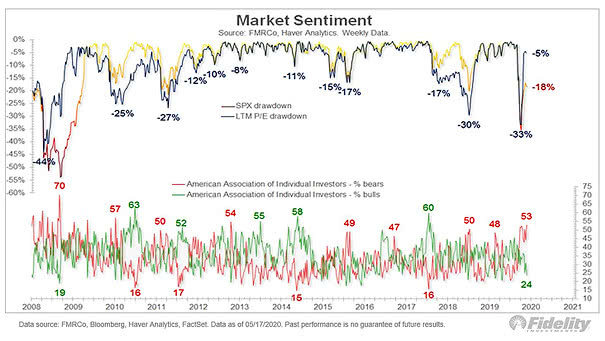
Market Sentiment (AAII) Are AAII investors too bearish? The S&P 500 is up 30%, but there are now more bears than at the March lows. Image: Fidelity Investments
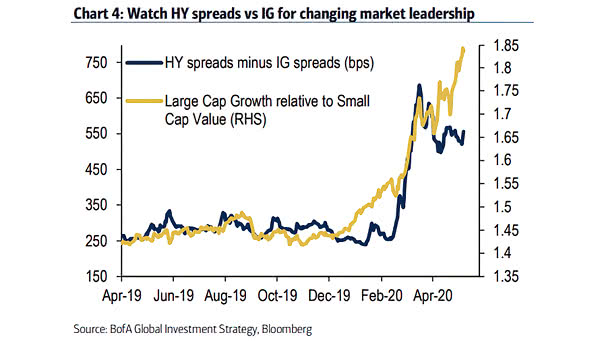
U.S. High Yield Spreads vs. IG Spreads and Large Cap Growth Relative to Small Cap Value This chart suggests that new highs in stocks need high yield outperformance and sustained rotation from large cap growth to small cap value. Image: BofA Global Investment Strategy
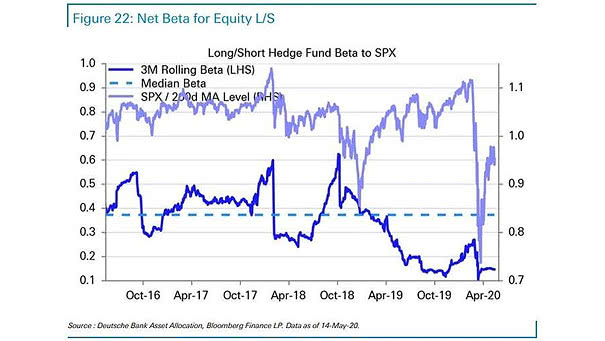
Long/Short Hedge Fund Beta to S&P 500 The long/short hedge fund beta to S&P 500 remains very low. Image: Deutsche Bank Asset Allocation
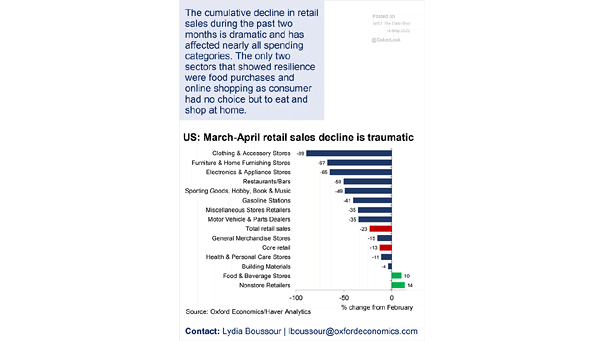
U.S. Retail Sales in March-April 2020 U.S. retail sales from March to April is dramatic and tumbled by a record 16.4%. Image: Oxford Economics
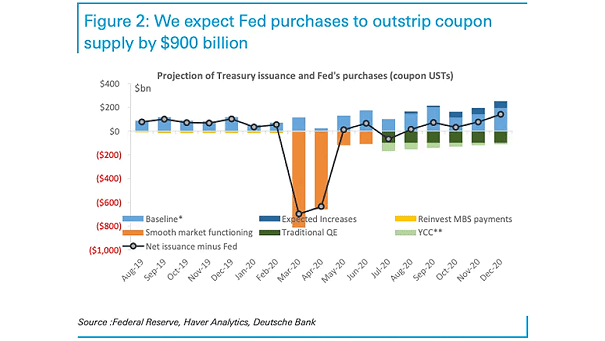
Projection of Treasury Issuance and Fed’s Purchases Deutsche Bank expects that Fed demand alone will outstrip Treasury supply by approximately $900 billion over the rest of 2020. Image: Deutsche Bank
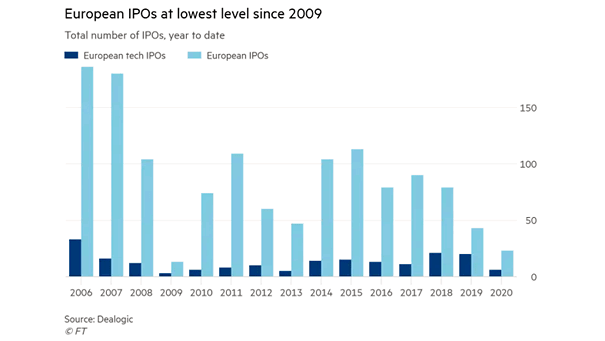
European IPOs This chart highlights the sharp slowdown in European IPO activity. Image: Financial Times
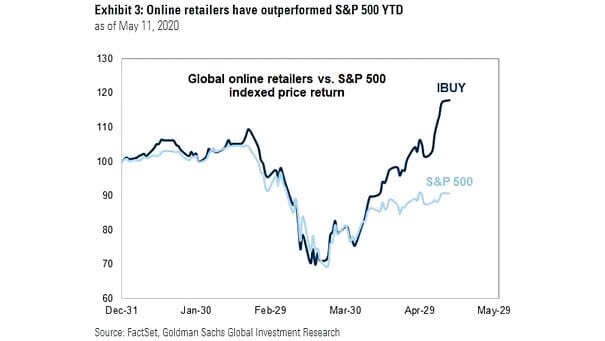
Global Online Retailers vs. S&P 500 Indexed Price Return Global online retailers saw rise in traffic during the coronavirus pandemic. They have outperformed the S&P 500 year-to-date. Image: Goldman Sachs Global Investment Research
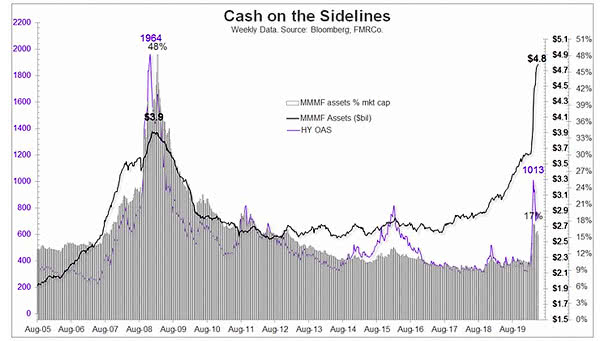
Cash on the Sidelines in Money Market Mutual Funds How much cash is sitting in money market mutual funds, waiting to come back to the market? $4.8 trillion, which is about 16% of market capitalization. Image: Fidelity Investments
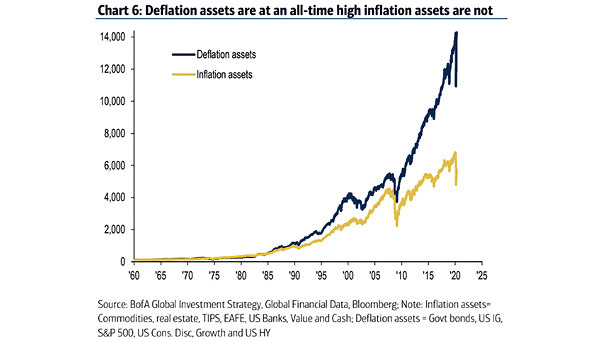
Inflation Assets vs. Deflation Assets The leadership remains deflationary, and the laggards remain inflationary. Deflation assets: government bonds, U.S. investment grade, S&P 500, U.S. consumer discretionary, growth and US high yield. Inflation assets: TIPS, EAFE, U.S. banks, value and cash. Image: BofA Global Investment Strategy