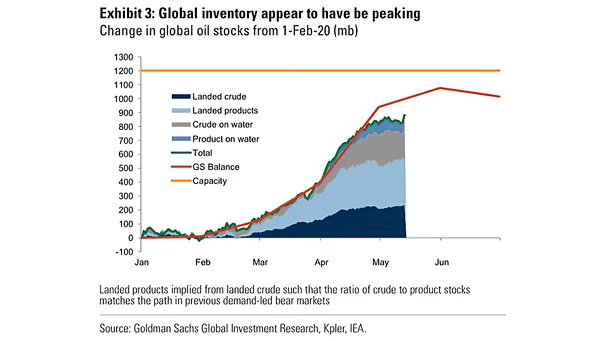
U.S. Recession Job Losses

U.S. Recession Job Losses Will the U.S. economy see a V-shaped recovery? This chart shows the latest two months of job losses compared with recessions since World War II. Image: CNBC

S&P 500 Comparison to 2000 and 2008

S&P 500 Comparison to 2000 and 2008 This chart shows the most recent stock market crash compared to the bear markets of 2000 and 2008. Image: Nautilus Research

Coronavirus Baseline Hit to the Level of U.S. Real GDP

Coronavirus Baseline Hit to the Level of U.S. Real GDP In years-on-years terms, Goldman Sachs expects -12.6% in Q2, -7.3% in Q3, -5.4% in Q4, and -6.5% for the whole year of 2020. Image: Goldman Sachs Global Investment Research

GWIM Flows to Cash 4WMA

GWIM Flows to Cash 4WMA BofA private clients have raised record amounts of cash amid uncertainty in the global economy. Image: BofA Global Investment Strategy

Technology Relative to the S&P 500

Technology Relative to the S&P 500 This chart suggests that technology is positioned to test its tech bubble highs from 2000. Image: BofA Global Research