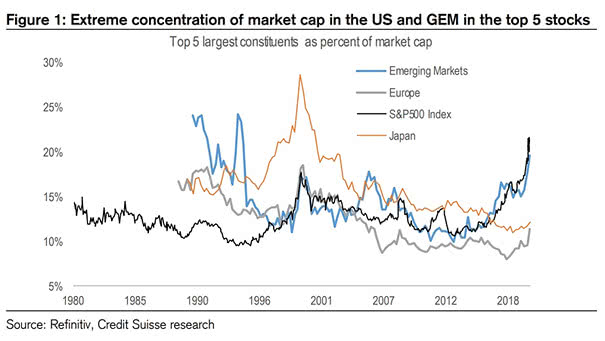
Aggregate EPS Growth
Aggregate EPS Growth U.S. earnings are outperforming the rest of the world in Q1:2020, because the U.S. was the slowest to lock down its economy. Image: Deutsche Bank Asset Allocation
Valuation – P/E Ratio Spread Between Russell 1000 Growth and Russell 1000 Value The P/E valuation spread for Growth vs. Value at 12.88 is nowhere near the 46.47 level seen at the 2000 peak and suggests that Growth should continue to beat value. Image: BofA Global Research
Recovery of the U.S. Economy – Republicans vs. Democrats Republicans and Democrats have different views on the recovery of the U.S. economy. Republicans are eager to reopen economy, while Democrats are more cautious. Image: Financial Times
U.S. Job Losses During Recessions The U.S. jobs report for April brings sobering news. Image: Oxford Economics
S&P 500 Current P/E Valuation Based on 2021 EPS Scenarios Goldman Sachs baseline forecast for S&P 500 earnings in 2021 is $170, and the downside forecast is $115. Today, the S&P 500 trades at 19.5x the buy-side estimate of EPS. Image: Goldman Sachs Global Investment Research
U.S. Recessions vs. U.S. GDP Growth If history is any guide, this chart suggests a V-shaped recovery. Image: Morgan Stanley Research
Russell 1000 Growth vs. Russell 1000 Value BofA suggests that the relative strength for Growth could continue, as the P/E valuation spread for Growth vs Value at 12.88 is nowhere near the 46.47 level seen at the 2000 peak. Image: BofA Global Research
ISM Manufacturing PMI vs. Cyclicals/Defensives The outperformance of U.S. cyclicals could suggest that the U.S. economic activity has bottomed. Image: Gavekal, Macrobond
Gold’s Last Bull Market and Gold/S&P 500 Correlation During the GFC, the correlation between gold and the S&P 500 was positive. Deutsche Bank suggests that gold could move higher, as investor confidence remains subdued. Image: Deutsche Bank
Percentage Share of Advanced Countries GDP Recording Negative Real Interest Rate Since 1314 This chart shows the record high level of advanced countries GDP experiencing negative real interest rates. Image: Deutsche Bank Global Research
Net Issuance – Agency MBS, IG Corporate Credit, and U.S. Treasury Bills and Coupons March and April saw record paces of IG issuance. YTD total of net supply in IG is above last year’s number. Image: Goldman Sachs Global Investment Research