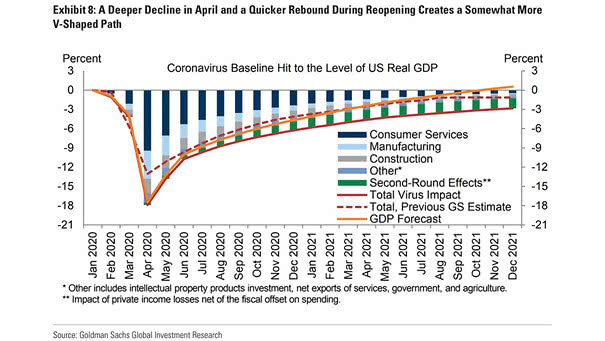
Weekly Gold Fund Flows
Weekly Gold Fund Flows Gold funds saw a significant net increase in holding, as investors sought a defensive position after a month of volatility. Image: BofA Global Investment Strategy
U.S. Tech and Global Markets – Nasdaq Composite vs. MSCI World ex. U.S. This chart shows the dominance of U.S. tech companies in global markets, as the Nasdaq has grown bigger than the rest of the world’s stock market. Image: Goldman Sachs Global Investment Research
U.S. Dollar Index and Fed Excess Reserves Fed excess reserves suggest lower U.S. dollar ahead. Image: BofA Research Investment Committee
U.S. Imports of Gold U.S. imports of gold increased significantly in March 2020, amid fears of shortages. Image: Pictet Wealth Management
S&P 500 vs. AAII Sentiment Survey AAII survey is more bearish than in March, as U.S. individual investors remain pessimistic about the rally. Image: Hondo Tomasz
Nasdaq vs. S&P 500 and Dow Jones The Nasdaq Composite is back into positive territory for 2020, after the sharp sell off in March. Image: CNBC
S&P 500 Real Return and Secular Bull Market Analogs Since the Great Recession, U.S. stocks have behaved like a secular bull market. Image: Fidelity Investments
U.S. Total Disposable Personal Income This chart suggests that disposable personal income will be positive in Q2/Q3 2020. Image: Goldman Sachs Global Investment Research
Valuation – Global: Gold Mining vs. Broad Market Chart suggesting that gold miners have upside, but a pause is needed first. Image: BCA Research
U.S. Jobless Claims Jobless claims are falling, but remain very high. Image: Pantheon Macroeconomics
2020 Consensus Earnings Expectations over the Past 12 Months While earnings expectations across the world have been revised downward, the S&P 500 is rising as nations ease lockdowns. Image: Goldman Sachs Global Investment Research